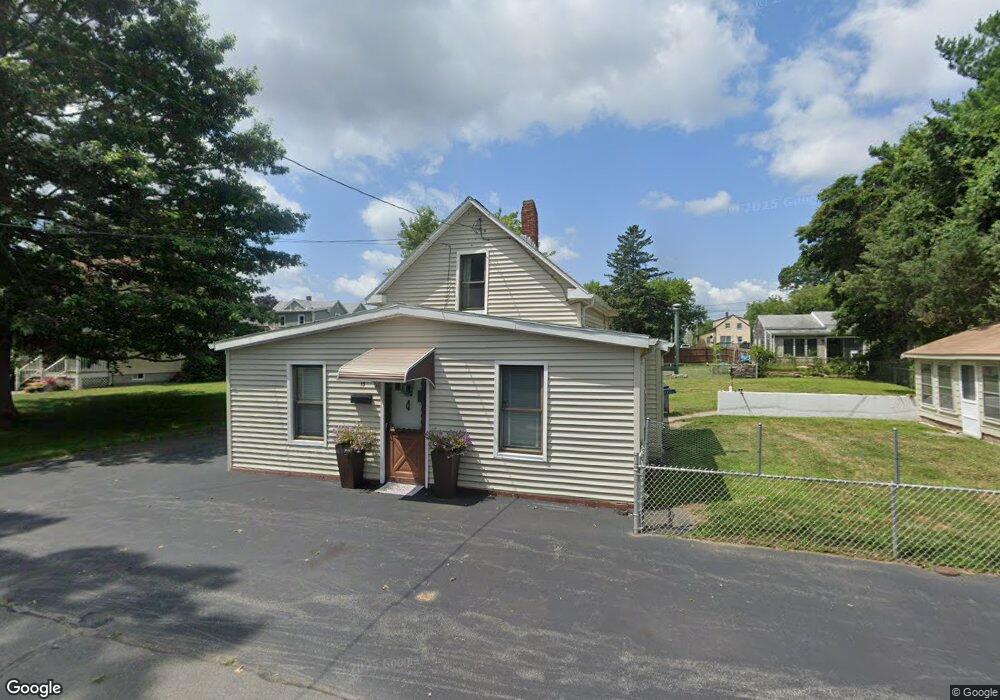
15 Coulombe St Acushnet, MA 02743
Estimated Value: $333,000 - $384,000
3
Beds
1
Bath
969
Sq Ft
$369/Sq Ft
Est. Value
About This Home
This home is located at 15 Coulombe St, Acushnet, MA 02743 and is currently estimated at $357,837, approximately $369 per square foot. 15 Coulombe St is a home located in Bristol County with nearby schools including Acushnet Elementary School, Albert F Ford Middle School, and Alma Del Mar Charter School.
Ownership History
Date
Name
Owned For
Owner Type
Purchase Details
Closed on
Aug 24, 2022
Sold by
Farfalowski Georgette
Bought by
Lucien and Lucien Lussier B
Current Estimated Value
Purchase Details
Closed on
Aug 23, 2022
Sold by
Lucien and Lucien Lussier B
Bought by
Farfalowski Georgette
Purchase Details
Closed on
Jul 7, 2017
Sold by
Lussier Barbara A
Bought by
Lucien and Lucien Barbara Lussier
Purchase Details
Closed on
May 26, 2006
Sold by
Farfalowski Edward and Farfalowski Georgette
Bought by
Lussier Barbara Ann
Create a Home Valuation Report for This Property
The Home Valuation Report is an in-depth analysis detailing your home's value as well as a comparison with similar homes in the area
Home Values in the Area
Average Home Value in this Area
Purchase History
| Date | Buyer | Sale Price | Title Company |
|---|---|---|---|
| Lucien | -- | None Available | |
| Farfalowski Georgette | -- | None Available | |
| Lucien | -- | -- | |
| Lussier Barbara Ann | -- | -- |
Source: Public Records
Tax History
| Year | Tax Paid | Tax Assessment Tax Assessment Total Assessment is a certain percentage of the fair market value that is determined by local assessors to be the total taxable value of land and additions on the property. | Land | Improvement |
|---|---|---|---|---|
| 2025 | $29 | $271,900 | $96,100 | $175,800 |
| 2024 | $2,792 | $244,700 | $92,000 | $152,700 |
| 2023 | $2,657 | $221,400 | $83,600 | $137,800 |
| 2022 | $2,727 | $205,500 | $79,400 | $126,100 |
| 2021 | $2,516 | $181,900 | $79,400 | $102,500 |
| 2020 | $2,536 | $181,900 | $79,400 | $102,500 |
| 2019 | $2,455 | $173,100 | $79,400 | $93,700 |
| 2018 | $5,961 | $166,300 | $79,400 | $86,900 |
| 2017 | $2,296 | $159,000 | $79,400 | $79,600 |
| 2016 | $2,197 | $151,200 | $79,400 | $71,800 |
| 2015 | $2,159 | $151,200 | $79,400 | $71,800 |
Source: Public Records
Map
Nearby Homes
- 14 Hayes St Unit 1
- 12 Hayes St Unit 1
- 12 White St
- 11 Boylston St
- 0 Hathaway Rd Unit 73469544
- 91 S Main St
- 122 Truro St
- 23 Oliveira Ave
- 112 Lawson Ave
- 81 Sylvia St
- 20 Jake Ln
- 4 Sam St
- 25 Pershing Ave
- 5 William St
- 44 Bernard St
- 34 Chicopee St
- 1940-1942 Acushnet Ave
- 14 Caswell St
- 15 Ball St
- 27 Meadow Ln
Your Personal Tour Guide
Ask me questions while you tour the home.