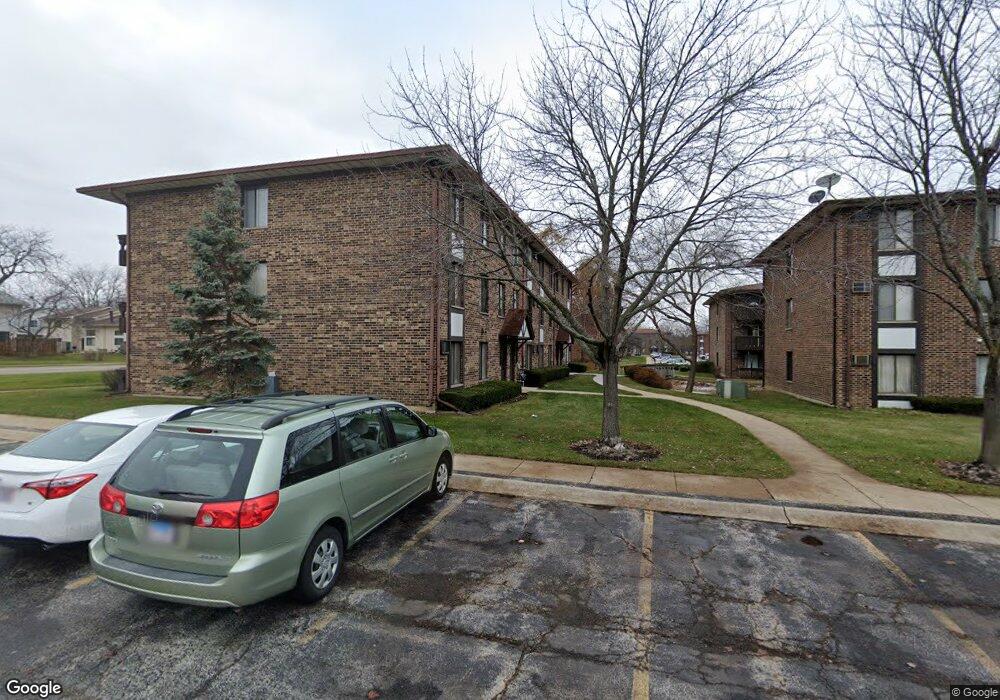
15 Crestview Ln Unit 3 Vernon Hills, IL 60061
Estimated Value: $157,000 - $178,000
--
Bed
2
Baths
818
Sq Ft
$202/Sq Ft
Est. Value
About This Home
This home is located at 15 Crestview Ln Unit 3, Vernon Hills, IL 60061 and is currently estimated at $164,885, approximately $201 per square foot. 15 Crestview Ln Unit 3 is a home located in Lake County with nearby schools including Hawthorn School Of Dual Language, Hawthorn Townline Elementary School, and Hawthorn Middle School North.
Ownership History
Date
Name
Owned For
Owner Type
Purchase Details
Closed on
Jul 8, 2011
Sold by
Shen Kuo Hua Chang
Bought by
Shen Amy Chi Li and Shen Amy Chi Yi
Current Estimated Value
Purchase Details
Closed on
Dec 21, 2007
Sold by
Lin Yi Wen
Bought by
Shen Kuo Hua Chang and Shen Land Trust
Purchase Details
Closed on
May 7, 2005
Sold by
Shen Melody
Bought by
Lin Yi Wen
Purchase Details
Closed on
Sep 29, 2000
Sold by
Lehman Richard A and Lehman Barbara M
Bought by
Shen Melody
Home Financials for this Owner
Home Financials are based on the most recent Mortgage that was taken out on this home.
Original Mortgage
$25,000
Interest Rate
7.99%
Mortgage Type
Seller Take Back
Purchase Details
Closed on
Feb 28, 1997
Sold by
Lehman Richard A
Bought by
Lehman Richard A and Lehman Barbara M
Create a Home Valuation Report for This Property
The Home Valuation Report is an in-depth analysis detailing your home's value as well as a comparison with similar homes in the area
Home Values in the Area
Average Home Value in this Area
Purchase History
| Date | Buyer | Sale Price | Title Company |
|---|---|---|---|
| Shen Amy Chi Li | $90,000 | First American Title Ins Co | |
| Shen Kuo Hua Chang | $110,000 | First American Title Ins Co | |
| Lin Yi Wen | $102,000 | Ticor | |
| Shen Melody | $71,000 | -- | |
| Lehman Richard A | -- | -- |
Source: Public Records
Mortgage History
| Date | Status | Borrower | Loan Amount |
|---|---|---|---|
| Previous Owner | Shen Melody | $25,000 |
Source: Public Records
Tax History Compared to Growth
Tax History
| Year | Tax Paid | Tax Assessment Tax Assessment Total Assessment is a certain percentage of the fair market value that is determined by local assessors to be the total taxable value of land and additions on the property. | Land | Improvement |
|---|---|---|---|---|
| 2024 | $3,014 | $43,648 | $12,693 | $30,955 |
| 2023 | $2,675 | $40,258 | $11,707 | $28,551 |
| 2022 | $2,675 | $34,657 | $11,253 | $23,404 |
| 2021 | $2,551 | $33,911 | $11,011 | $22,900 |
| 2020 | $2,452 | $33,341 | $10,826 | $22,515 |
| 2019 | $2,391 | $33,024 | $10,723 | $22,301 |
| 2018 | $1,578 | $24,275 | $10,608 | $13,667 |
| 2017 | $1,547 | $23,509 | $10,273 | $13,236 |
| 2016 | $1,460 | $22,290 | $9,740 | $12,550 |
| 2015 | $1,406 | $20,834 | $9,104 | $11,730 |
| 2014 | $1,593 | $19,896 | $8,857 | $11,039 |
| 2012 | $2,040 | $22,550 | $10,038 | $12,512 |
Source: Public Records
Map
Nearby Homes
- 15 Crestview Ln Unit 4
- 1028 Cumberland Ct
- 1109 Grant Place
- 11 Echo Ct Unit 12
- 4 Parkside Ct Unit 12
- 365 Jefferson Ct Unit 65
- 20 Echo Ct Unit 3
- 139 Windsor Dr Unit 123
- 464 Buchanan Ct
- 717 Summit Ln
- 240 Southwick Ct Unit 52
- 215 Coventry Cir Unit 215
- 608 Sycamore St
- 1434 Maidstone Dr
- 1654 Pebble Beach Way
- 900 S Butterfield Rd
- 410 Bay Tree Cir
- 418 Bay Tree Cir
- 1290 Butterfield Rd
- 561 Saddlebrook Ln Unit 161
- 15 Crestview Ln Unit 8
- 15 Crestview Ln Unit 12
- 15 Crestview Ln Unit 11
- 15 Crestview Ln
- 15 Crestview Ln Unit 7
- 17 Crestview Ln Unit 10
- 17 Crestview Ln Unit 9
- 17 Crestview Ln Unit 6
- 17 Crestview Ln Unit 5
- 17 Crestview Ln Unit 2
- 17 Crestview Ln Unit 1
- 13 Crestview Ln Unit 4
- 13 Crestview Ln Unit 12
- 13 Crestview Ln Unit 11
- 13 Crestview Ln Unit 8
- 13 Crestview Ln Unit 5
- 13 Crestview Ln Unit 3
- 13 Crestview Ln Unit 7
- 11 Crestview Ln Unit 9
- 11 Crestview Ln Unit 2