Estimated Value: $329,539 - $365,000
3
Beds
2
Baths
1,816
Sq Ft
$192/Sq Ft
Est. Value
About This Home
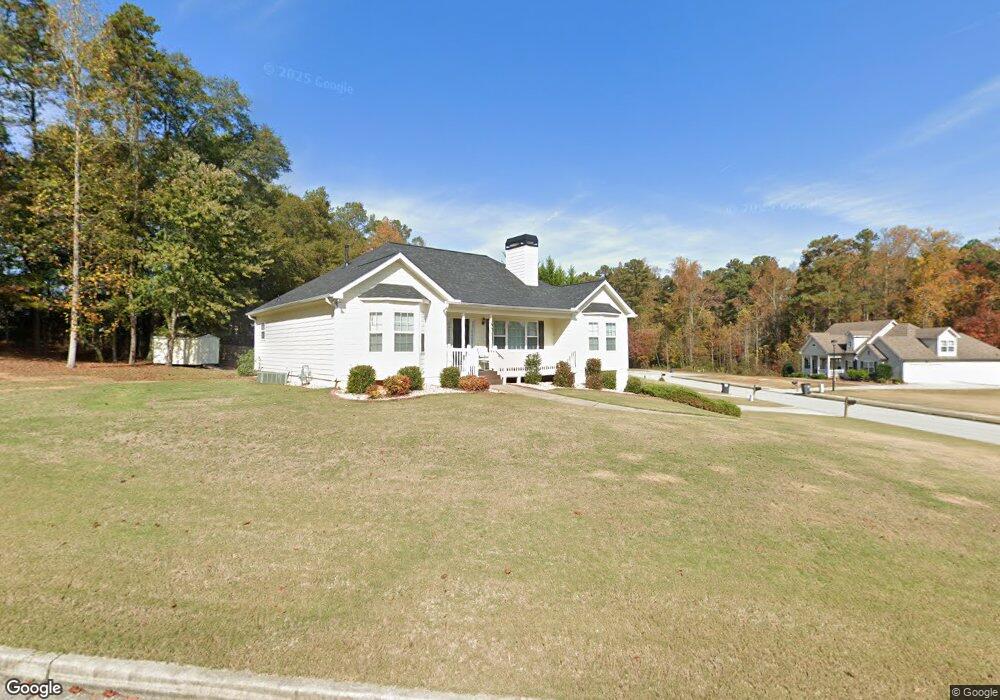
This home is located at 15 Cross Pointe Ct, Hiram, GA 30141 and is currently estimated at $347,885, approximately $191 per square foot. 15 Cross Pointe Ct is a home located in Paulding County with nearby schools including Bessie L. Baggett Elementary School, Irma C. Austin Middle School, and Hiram High School.
Ownership History
Date
Name
Owned For
Owner Type
Purchase Details
Closed on
Aug 15, 2011
Sold by
Cartus Corp
Bought by
Woolfolk Samuel L
Current Estimated Value
Purchase Details
Closed on
Jun 16, 2011
Sold by
Hitt Brenda S and Hitt James
Bought by
Cartus Corp
Purchase Details
Closed on
Jul 29, 2004
Sold by
Turn Key Builders Inc
Bought by
Hitt Brenda S and Hitt James
Home Financials for this Owner
Home Financials are based on the most recent Mortgage that was taken out on this home.
Original Mortgage
$15,780
Interest Rate
6.19%
Mortgage Type
New Conventional
Purchase Details
Closed on
Mar 25, 2004
Sold by
Rice Land Inc
Bought by
Turn Kay Builders Inc
Home Financials for this Owner
Home Financials are based on the most recent Mortgage that was taken out on this home.
Original Mortgage
$124,000
Interest Rate
5.53%
Create a Home Valuation Report for This Property
The Home Valuation Report is an in-depth analysis detailing your home's value as well as a comparison with similar homes in the area
Home Values in the Area
Average Home Value in this Area
Purchase History
| Date | Buyer | Sale Price | Title Company |
|---|---|---|---|
| Woolfolk Samuel L | $110,325 | -- | |
| Cartus Corp | $127,000 | -- | |
| Hitt Brenda S | $157,900 | -- | |
| -- | $157,900 | -- | |
| Turn Kay Builders Inc | -- | -- |
Source: Public Records
Mortgage History
| Date | Status | Borrower | Loan Amount |
|---|---|---|---|
| Previous Owner | -- | $15,780 | |
| Previous Owner | -- | $142,020 | |
| Previous Owner | Turn Kay Builders Inc | $124,000 |
Source: Public Records
Tax History Compared to Growth
Tax History
| Year | Tax Paid | Tax Assessment Tax Assessment Total Assessment is a certain percentage of the fair market value that is determined by local assessors to be the total taxable value of land and additions on the property. | Land | Improvement |
|---|---|---|---|---|
| 2024 | $932 | $137,976 | $12,000 | $125,976 |
| 2023 | $1,038 | $130,820 | $12,000 | $118,820 |
| 2022 | $918 | $114,396 | $12,000 | $102,396 |
| 2021 | $1,013 | $102,224 | $12,000 | $90,224 |
| 2020 | $844 | $81,036 | $12,000 | $69,036 |
| 2019 | $798 | $74,160 | $12,000 | $62,160 |
| 2018 | $741 | $69,844 | $16,000 | $53,844 |
| 2017 | $721 | $65,812 | $16,000 | $49,812 |
| 2016 | $699 | $65,552 | $16,000 | $49,552 |
| 2015 | $778 | $69,632 | $16,000 | $53,632 |
| 2014 | $764 | $64,724 | $16,000 | $48,724 |
| 2013 | -- | $52,840 | $16,000 | $36,840 |
Source: Public Records
Map
Nearby Homes
- 35 Cross Pointe Ct
- 45 Elkay Ct
- 521 Cross Pointe Way
- 545 Cross Pointe Way
- 506 Cross Pointe Way Unit 2
- 140 Hayes Trace
- 566 Cross Pointe Way
- 0 Elkay Ct Unit 7362273
- 0 Elkay Ct Unit 7329728
- 0 Elkay Ct Unit 7241695
- 0 Elkay Ct Unit 8380110
- 0 Elkay Ct
- 154 Hayes Trace
- 30 Elkay Ct
- 52 Cross Pointe Ct Unit 2
- 497 Cross Pointe Way
- 73 Cross Pointe Ct
- 44 Elkay Ct
- 170 Hayes Trace
- 177 Starlyn Dr