C
Landlord's Agent in 2015
Chia-hui Chao
Brenda Sun & Associates
(914) 588-9798
3 Total Sales
Estimated Value: $936,000 - $960,000
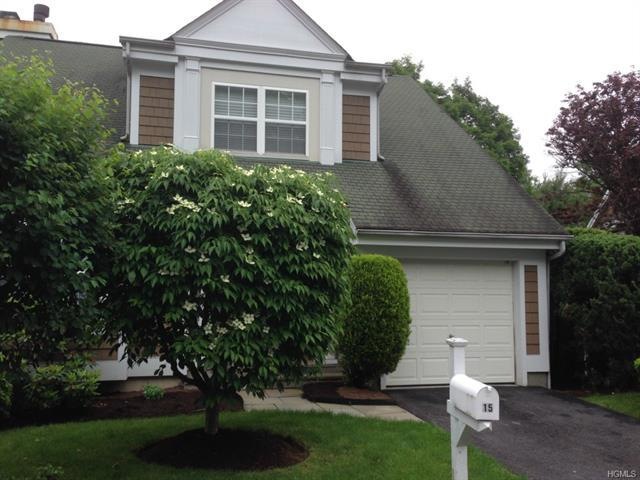
Beautiful End-unit town house in Wyndrest, Sunny and Spacious, 1st Fl. Master BR. Hardwood flrs in LR/DR w/ Vaulted ceilings & gas fpl. Dr/ large SGD to Deck, EIK with Brand New Stainless Appliances, Huge loft overlooks 1st flr. with lots of closet and storage space. plus Large FR/walkout to patio. Community Pool, Basketball & walk to town& bike path. Close to all major highways, buses & Scarborough Train Station.
Last Agent to Rent the Property
Brenda Sun & Associates Brokerage Phone: 800-222-6753 License #10301209424 Listed on: 04/23/2015
Last Renter's Agent
Brenda Sun & Associates Brokerage Phone: 800-222-6753 License #10301209424 Listed on: 04/23/2015
| Date | Buyer | Sale Price | Title Company |
|---|---|---|---|
| Mascari Jacob | $624,000 | New York Title |
| Date | Status | Borrower | Loan Amount |
|---|---|---|---|
| Open | Mascari Jacob | $527,000 |
| Date | Event | Price | List to Sale | Price per Sq Ft | Prior Sale |
|---|---|---|---|---|---|
| 06/27/2015 06/27/15 | Rented | $4,200 | -16.0% | -- | |
| 05/28/2015 05/28/15 | Under Contract | -- | -- | -- | |
| 04/23/2015 04/23/15 | For Rent | $5,000 | 0.0% | -- | |
| 03/26/2014 03/26/14 | Sold | $670,000 | +3.2% | $223 / Sq Ft | View Prior Sale |
| 02/28/2014 02/28/14 | Pending | -- | -- | -- | |
| 02/07/2014 02/07/14 | For Sale | $649,000 | -- | $216 / Sq Ft |
| Year | Tax Paid | Tax Assessment Tax Assessment Total Assessment is a certain percentage of the fair market value that is determined by local assessors to be the total taxable value of land and additions on the property. | Land | Improvement |
|---|---|---|---|---|
| 2024 | $12,882 | $455,200 | $121,000 | $334,200 |
| 2023 | $12,470 | $441,400 | $121,000 | $320,400 |
| 2022 | $12,712 | $406,400 | $121,000 | $285,400 |
| 2021 | $11,908 | $391,900 | $121,000 | $270,900 |
| 2020 | $11,738 | $378,700 | $121,000 | $257,700 |
| 2019 | $11,872 | $371,000 | $121,000 | $250,000 |
| 2018 | $9,352 | $371,000 | $121,000 | $250,000 |
| 2017 | $1,780 | $354,900 | $121,000 | $233,900 |
| 2016 | $143,658 | $354,900 | $121,000 | $233,900 |
| 2015 | $11,359 | $19,880 | $11,300 | $8,580 |
| 2014 | $11,359 | $19,880 | $11,300 | $8,580 |
| 2013 | $11,359 | $19,880 | $11,300 | $8,580 |
C
Landlord's Agent in 2015
Chia-hui Chao
Brenda Sun & Associates
(914) 588-9798
3 Total Sales

Seller's Agent in 2014
Suzan Zeolla
Houlihan Lawrence Inc.
(914) 557-1885
40 in this area
115 Total Sales
Source: OneKey® MLS
MLS Number: KEY4516994
APN: 4201-098-007-00000-000-0004-000-20-1
Disclaimer: Certain information contained herein is derived from information provided by parties other than Homes.com. All information provided is deemed reliable, but is not guaranteed to be accurate and should be independently verified.
![]() The data relating to real estate for sale or lease on this web site comes in part from OneKey® MLS. Real estate listings held by brokerage firms other than Ten-X are marked with the OneKey® MLS logo or an abbreviated logo and detailed information about them includes the name of the listing broker.
The data relating to real estate for sale or lease on this web site comes in part from OneKey® MLS. Real estate listings held by brokerage firms other than Ten-X are marked with the OneKey® MLS logo or an abbreviated logo and detailed information about them includes the name of the listing broker.
IDX information is provided exclusively for personal, non-commercial use, and may not be used for any purpose other than to identify prospective properties consumers may be interested in purchasing.
Information is deemed reliable but not guaranteed.
Copyright 2025 OneKey® MLS. All rights reserved.