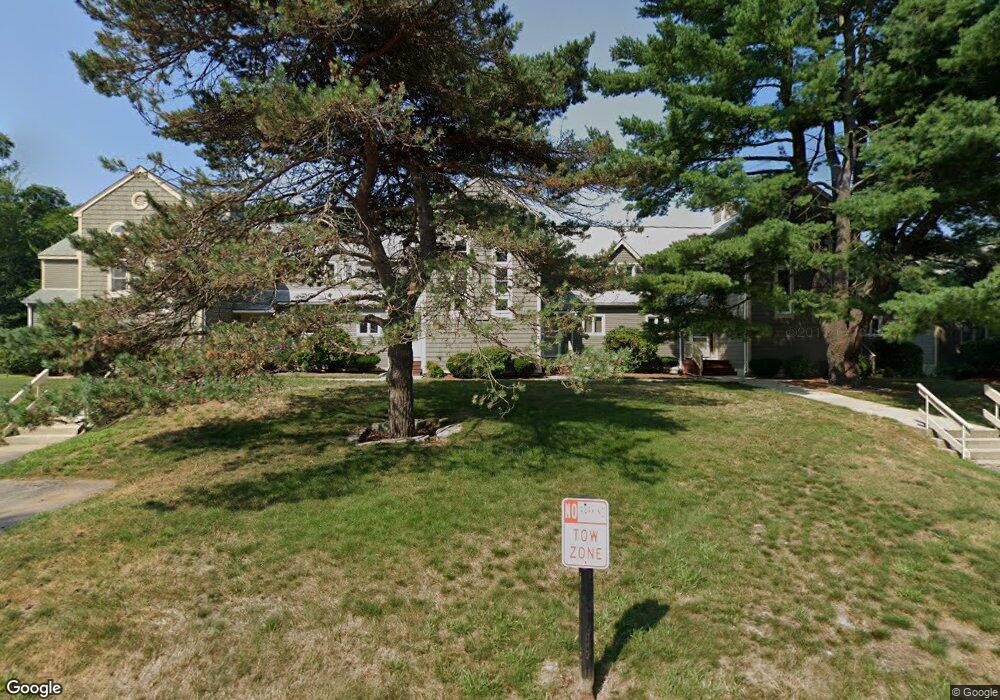
15 Devlin Cir Unit 4,7 Blackstone, MA 01504
Estimated Value: $388,000 - $477,000
2
Beds
2
Baths
1,594
Sq Ft
$261/Sq Ft
Est. Value
About This Home
This home is located at 15 Devlin Cir Unit 4,7, Blackstone, MA 01504 and is currently estimated at $416,770, approximately $261 per square foot. 15 Devlin Cir Unit 4,7 is a home located in Worcester County with nearby schools including Blackstone-Millville Regional High School, Rise Prep Mayoral Academy Middle School, and Rise Prep Mayoral Academy.
Ownership History
Date
Name
Owned For
Owner Type
Purchase Details
Closed on
Oct 2, 1997
Sold by
Cusick Francis R and Cusick Ellen A
Bought by
Tompkins Kyle M and Miano Lisa M
Current Estimated Value
Home Financials for this Owner
Home Financials are based on the most recent Mortgage that was taken out on this home.
Original Mortgage
$90,000
Interest Rate
7.41%
Mortgage Type
Purchase Money Mortgage
Create a Home Valuation Report for This Property
The Home Valuation Report is an in-depth analysis detailing your home's value as well as a comparison with similar homes in the area
Home Values in the Area
Average Home Value in this Area
Purchase History
| Date | Buyer | Sale Price | Title Company |
|---|---|---|---|
| Tompkins Kyle M | $94,000 | -- |
Source: Public Records
Mortgage History
| Date | Status | Borrower | Loan Amount |
|---|---|---|---|
| Open | Tompkins Kyle M | $100,000 | |
| Closed | Tompkins Kyle M | $90,000 |
Source: Public Records
Tax History
| Year | Tax Paid | Tax Assessment Tax Assessment Total Assessment is a certain percentage of the fair market value that is determined by local assessors to be the total taxable value of land and additions on the property. | Land | Improvement |
|---|---|---|---|---|
| 2025 | $4,633 | $306,800 | $0 | $306,800 |
| 2024 | $4,345 | $266,100 | $0 | $266,100 |
| 2023 | $2,948 | $182,200 | $0 | $182,200 |
| 2022 | $3,261 | $182,200 | $0 | $182,200 |
| 2021 | $3,411 | $182,200 | $0 | $182,200 |
| 2020 | $3,267 | $173,200 | $0 | $173,200 |
| 2019 | $3,181 | $168,200 | $0 | $168,200 |
| 2018 | $3,031 | $155,500 | $0 | $155,500 |
| 2017 | $3,070 | $159,400 | $0 | $159,400 |
| 2016 | $3,342 | $172,800 | $0 | $172,800 |
| 2015 | $3,407 | $174,900 | $0 | $174,900 |
Source: Public Records
Map
Nearby Homes
- 10 Huntington Ave
- 11 Federal St
- 60 Fairlawn Ave
- 44 Federal St
- 458 Prospect St
- 154 156 Winter St
- 550 Winter St
- 76 Main St
- 481 N Main St
- 308 Harris Ave
- 83 Summer St
- 164 W School St
- 130 E School St
- 12 Market St
- 29 Graves Ave
- 187 Boyden St
- 84 Saint Paul St
- 81 Fountain St
- 107 Blackstone St
- 256 Privilege St
Your Personal Tour Guide
Ask me questions while you tour the home.