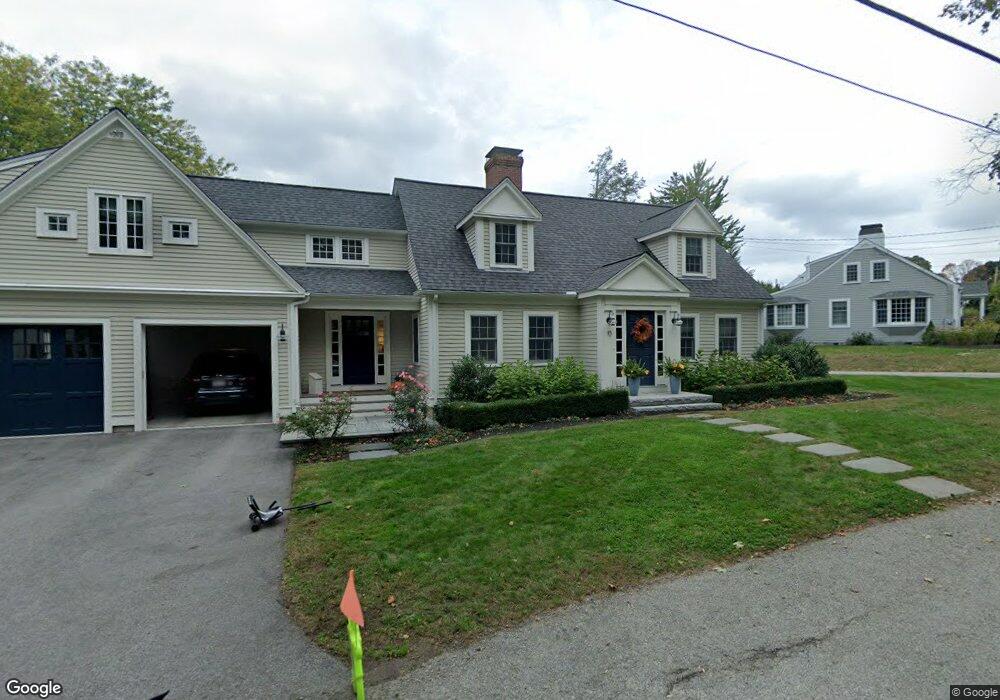
15 Downing St Hingham, MA 02043
Estimated Value: $1,786,000 - $2,311,000
3
Beds
3
Baths
3,914
Sq Ft
$525/Sq Ft
Est. Value
About This Home
This home is located at 15 Downing St, Hingham, MA 02043 and is currently estimated at $2,053,003, approximately $524 per square foot. 15 Downing St is a home located in Plymouth County with nearby schools including East Elementary School, Hingham Middle School, and Hingham High School.
Ownership History
Date
Name
Owned For
Owner Type
Purchase Details
Closed on
Apr 8, 2022
Sold by
Degreve Norman
Bought by
15 Downing St Rt
Current Estimated Value
Purchase Details
Closed on
Nov 9, 2020
Sold by
15 Downing Street Rt
Bought by
Degreve Norman W and Degreve Jessica G
Purchase Details
Closed on
Aug 12, 2020
Sold by
Degreve Norman and Degreve Jessica
Bought by
15 Downing Street Rt
Purchase Details
Closed on
Nov 2, 2012
Sold by
Goff Carleton N and Daubenspeck Janet G
Bought by
Degreve Norman and Degreve Jessica
Home Financials for this Owner
Home Financials are based on the most recent Mortgage that was taken out on this home.
Original Mortgage
$660,000
Interest Rate
3.5%
Mortgage Type
Purchase Money Mortgage
Purchase Details
Closed on
Feb 24, 2009
Sold by
Goff Carleton N
Bought by
Goff Carleton N and Daubenspeck Janet G
Create a Home Valuation Report for This Property
The Home Valuation Report is an in-depth analysis detailing your home's value as well as a comparison with similar homes in the area
Purchase History
| Date | Buyer | Sale Price | Title Company |
|---|---|---|---|
| 15 Downing St Rt | -- | None Available | |
| Degreve Norman W | -- | None Available | |
| 15 Downing Street Rt | -- | None Available | |
| Degreve Norman | $825,000 | -- | |
| Goff Carleton N | -- | -- |
Source: Public Records
Mortgage History
| Date | Status | Borrower | Loan Amount |
|---|---|---|---|
| Previous Owner | Degreve Norman | $660,000 |
Source: Public Records
Tax History Compared to Growth
Tax History
| Year | Tax Paid | Tax Assessment Tax Assessment Total Assessment is a certain percentage of the fair market value that is determined by local assessors to be the total taxable value of land and additions on the property. | Land | Improvement |
|---|---|---|---|---|
| 2025 | $17,035 | $1,593,500 | $718,300 | $875,200 |
| 2024 | $15,816 | $1,457,700 | $718,300 | $739,400 |
| 2023 | $13,613 | $1,361,300 | $718,300 | $643,000 |
| 2022 | $13,338 | $1,153,800 | $619,100 | $534,700 |
| 2021 | $12,795 | $1,084,300 | $619,100 | $465,200 |
| 2020 | $12,502 | $1,084,300 | $619,100 | $465,200 |
| 2019 | $12,350 | $1,045,700 | $619,100 | $426,600 |
| 2018 | $158 | $1,032,700 | $515,900 | $516,800 |
| 2017 | $12,724 | $1,038,700 | $536,600 | $502,100 |
| 2016 | $12,654 | $1,013,100 | $511,000 | $502,100 |
| 2015 | $12,386 | $988,500 | $486,400 | $502,100 |
Source: Public Records
Map
Nearby Homes
- 21 Downing St
- 11 Downing St
- 18 Downing St
- 7 Downing St
- 23 Downing St
- 22 Downing St
- 9 Pleasant St Unit 4
- 9 Pleasant St Unit 3
- 9 Pleasant St Unit 2
- 9 Pleasant St Unit 1
- 9 Pleasant St
- 7 Pleasant St
- 10 Downing St
- 15 Pleasant St
- 17 Pleasant St
- 5R Pleasant St
- 11 Pleasant St
- 11 Pleasant St Unit 2
- 11 Pleasant St Unit 1
- 11 Pleasant St Unit 3