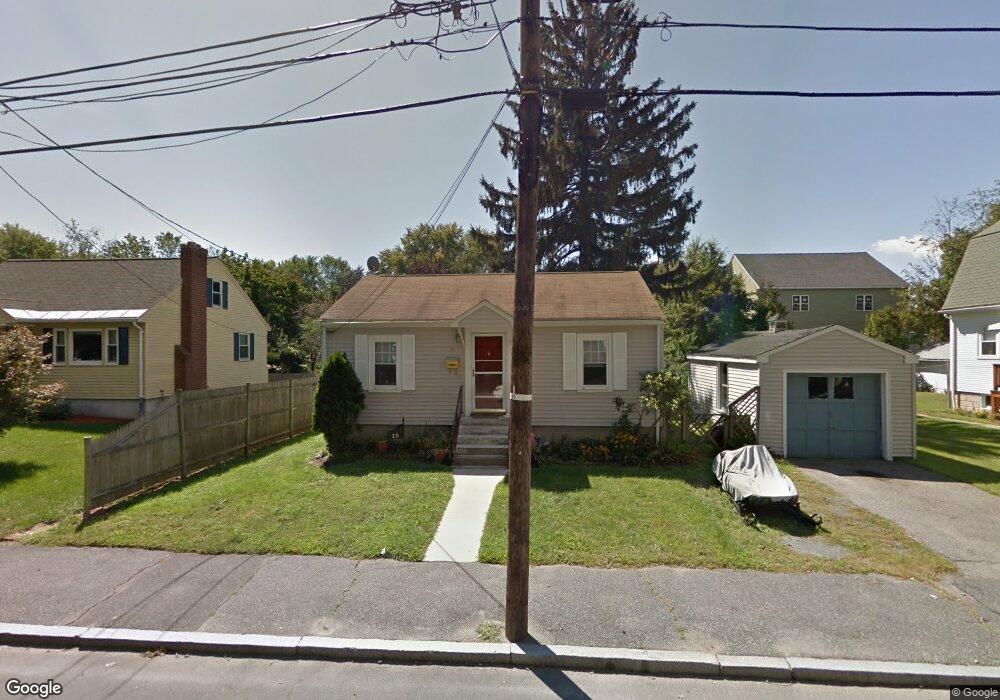
15 Draper Rd Framingham, MA 01702
Estimated Value: $438,000 - $462,000
2
Beds
1
Bath
1,124
Sq Ft
$400/Sq Ft
Est. Value
About This Home
This home is located at 15 Draper Rd, Framingham, MA 01702 and is currently estimated at $449,749, approximately $400 per square foot. 15 Draper Rd is a home located in Middlesex County with nearby schools including Framingham High School, Happy Hollow School, and Pincushion Hill Montessori School.
Ownership History
Date
Name
Owned For
Owner Type
Purchase Details
Closed on
Aug 16, 2019
Sold by
Morenzetti Joeleen E
Bought by
Morenzetti Joseph M and Morenzetti Amanda E
Current Estimated Value
Home Financials for this Owner
Home Financials are based on the most recent Mortgage that was taken out on this home.
Original Mortgage
$236,000
Outstanding Balance
$204,434
Interest Rate
3.7%
Mortgage Type
New Conventional
Estimated Equity
$245,315
Purchase Details
Closed on
May 31, 1990
Sold by
Day Frances E
Bought by
Morenzetti John E
Home Financials for this Owner
Home Financials are based on the most recent Mortgage that was taken out on this home.
Original Mortgage
$99,500
Interest Rate
10.25%
Mortgage Type
Purchase Money Mortgage
Create a Home Valuation Report for This Property
The Home Valuation Report is an in-depth analysis detailing your home's value as well as a comparison with similar homes in the area
Home Values in the Area
Average Home Value in this Area
Purchase History
| Date | Buyer | Sale Price | Title Company |
|---|---|---|---|
| Morenzetti Joseph M | $295,000 | -- | |
| Morenzetti Joseph M | $295,000 | -- | |
| Morenzetti John E | $99,500 | -- | |
| Morenzetti John E | $99,500 | -- |
Source: Public Records
Mortgage History
| Date | Status | Borrower | Loan Amount |
|---|---|---|---|
| Open | Morenzetti Joseph M | $236,000 | |
| Closed | Morenzetti Joseph M | $236,000 | |
| Previous Owner | Morenzetti John E | $25,000 | |
| Previous Owner | Morenzetti John E | $25,000 | |
| Previous Owner | Morenzetti John E | $99,500 |
Source: Public Records
Tax History
| Year | Tax Paid | Tax Assessment Tax Assessment Total Assessment is a certain percentage of the fair market value that is determined by local assessors to be the total taxable value of land and additions on the property. | Land | Improvement |
|---|---|---|---|---|
| 2025 | $4,706 | $394,100 | $200,800 | $193,300 |
| 2024 | $4,518 | $362,600 | $178,600 | $184,000 |
| 2023 | $4,219 | $322,300 | $159,600 | $162,700 |
| 2022 | $3,923 | $285,500 | $144,800 | $140,700 |
| 2021 | $3,861 | $274,800 | $139,100 | $135,700 |
| 2020 | $3,917 | $261,500 | $121,200 | $140,300 |
| 2019 | $3,800 | $247,100 | $115,500 | $131,600 |
| 2018 | $3,710 | $227,300 | $107,500 | $119,800 |
| 2017 | $3,601 | $215,500 | $103,500 | $112,000 |
| 2016 | $3,415 | $196,500 | $97,800 | $98,700 |
| 2015 | $3,384 | $189,900 | $97,600 | $92,300 |
Source: Public Records
Map
Nearby Homes
- 15 Bates Rd
- 24 Bates Rd
- 69 Gilbert St
- 20 Mulhall Dr
- 37 James Rd
- 140 Algonquin Trail
- 292 Hollis St
- 45 Half Crown Cir
- 25 Eames St
- 92 Alexander St
- 2 Arrowhead Cir Unit 2
- 81 Brush Hill Rd
- 768 Waverley St
- 11 Harmony Ln
- 45 Daytona Ave
- 10 Rhubena St
- 27 Gordon St Unit 305
- 29 Gordon St Unit 107
- 102 Captain Eames Cir
- 363 Eliot St
- 21 Draper Rd
- 12 Douglas Rd
- 9 Draper Rd
- 16 Douglas Rd
- 22 Draper Rd
- 22 Draper Rd Unit B
- 22 Draper Rd Unit A
- 24 Draper Rd
- 27 Draper Rd
- 20 Draper Rd
- 20 Draper Rd Unit 2
- 18 Douglas Rd
- 26 Draper Rd
- 68 Douglas Rd
- 12 Draper Rd
- 12 Draper Rd Unit 1
- 626 Hollis St
- 29 Draper Rd
- 636 Hollis St
- 13 Douglas Rd Unit 13
Your Personal Tour Guide
Ask me questions while you tour the home.