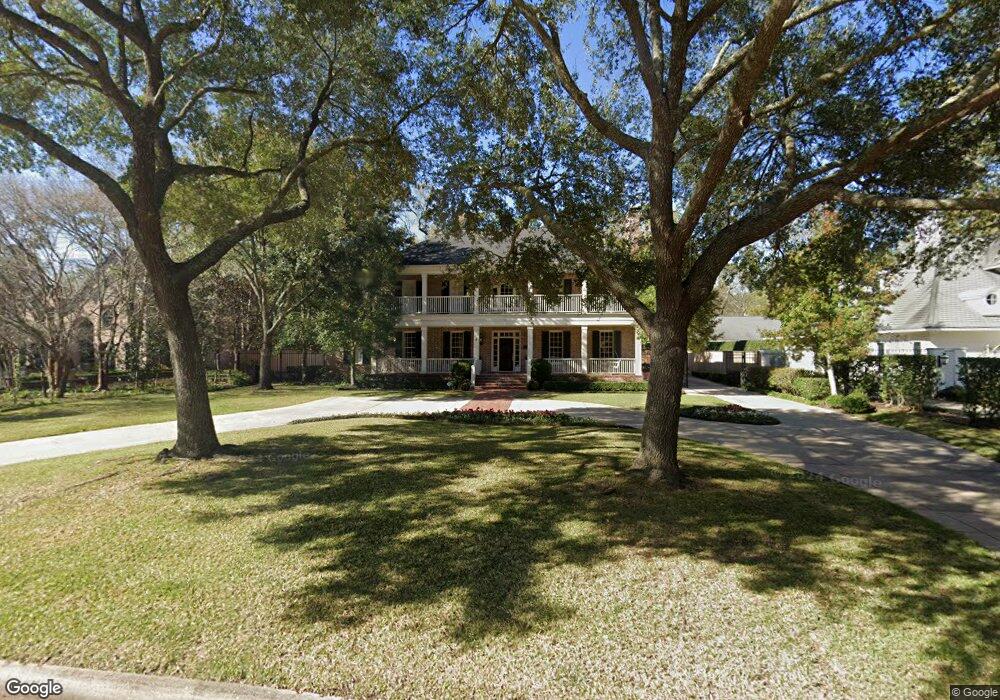
15 Dunnam Ln Houston, TX 77024
Estimated Value: $2,963,445 - $3,500,000
4
Beds
5
Baths
5,714
Sq Ft
$550/Sq Ft
Est. Value
About This Home
This home is located at 15 Dunnam Ln, Houston, TX 77024 and is currently estimated at $3,142,815, approximately $550 per square foot. 15 Dunnam Ln is a home located in Harris County with nearby schools including Memorial Drive Elementary School, Spring Branch Middle School, and Memorial High School.
Ownership History
Date
Name
Owned For
Owner Type
Purchase Details
Closed on
Dec 8, 2008
Sold by
Pfeffer Blake and Pfeffer Jeanne
Bought by
Dietert Jeff A and Dietert Margaret B
Current Estimated Value
Home Financials for this Owner
Home Financials are based on the most recent Mortgage that was taken out on this home.
Original Mortgage
$1,387,500
Outstanding Balance
$905,060
Interest Rate
5.87%
Mortgage Type
Purchase Money Mortgage
Estimated Equity
$2,237,755
Purchase Details
Closed on
Jul 1, 2004
Sold by
Retzloff Steven F and Retzloff Karen T
Bought by
Pfeffer Blake and Pfeffer Jeanne
Home Financials for this Owner
Home Financials are based on the most recent Mortgage that was taken out on this home.
Original Mortgage
$550,000
Interest Rate
5.5%
Mortgage Type
Purchase Money Mortgage
Create a Home Valuation Report for This Property
The Home Valuation Report is an in-depth analysis detailing your home's value as well as a comparison with similar homes in the area
Home Values in the Area
Average Home Value in this Area
Purchase History
| Date | Buyer | Sale Price | Title Company |
|---|---|---|---|
| Dietert Jeff A | -- | None Available | |
| Pfeffer Blake | -- | Stewart Title |
Source: Public Records
Mortgage History
| Date | Status | Borrower | Loan Amount |
|---|---|---|---|
| Open | Dietert Jeff A | $1,387,500 | |
| Previous Owner | Pfeffer Blake | $550,000 | |
| Closed | Pfeffer Blake | $450,000 |
Source: Public Records
Tax History Compared to Growth
Tax History
| Year | Tax Paid | Tax Assessment Tax Assessment Total Assessment is a certain percentage of the fair market value that is determined by local assessors to be the total taxable value of land and additions on the property. | Land | Improvement |
|---|---|---|---|---|
| 2025 | $31,181 | $2,399,698 | $1,212,900 | $1,186,798 |
| 2024 | $31,181 | $1,950,000 | $1,172,470 | $777,530 |
| 2023 | $31,181 | $1,900,655 | $1,111,825 | $788,830 |
| 2022 | $43,457 | $2,152,414 | $1,111,825 | $1,040,589 |
| 2021 | $41,147 | $1,900,000 | $1,051,180 | $848,820 |
| 2020 | $42,961 | $1,939,848 | $1,051,180 | $888,668 |
| 2019 | $45,610 | $1,977,312 | $1,051,180 | $926,132 |
| 2018 | $10,025 | $1,972,939 | $1,051,180 | $921,759 |
| 2017 | $46,471 | $2,014,647 | $1,051,180 | $963,467 |
| 2016 | $48,325 | $2,095,000 | $1,051,180 | $1,043,820 |
| 2015 | $34,121 | $2,127,009 | $1,051,180 | $1,075,829 |
| 2014 | $34,121 | $1,800,000 | $909,675 | $890,325 |
Source: Public Records
Map
Nearby Homes
- 11640 Greenbay St
- 11722 Claywood St
- 11607 Shady Grove Ln
- 11606 Blalock Ln
- 318 Knipp Rd
- 11711 Memorial Dr Unit 570
- 11711 Memorial Dr Unit 55
- 11711 Memorial Dr Unit 21
- 11711 Memorial Dr Unit 565
- 11711 Memorial Dr Unit 695
- 11711 Memorial Dr Unit 644
- 11711 Memorial Dr Unit 285
- 11711 Memorial Dr Unit 371
- 11711 Memorial Dr Unit 129
- 11711 Memorial Dr Unit 251
- 11711 Memorial Dr Unit 573
- 11711 Memorial Dr Unit 545
- 11711 Memorial Dr Unit 276
- 11711 Memorial Dr Unit 13
- 11711 Memorial Dr Unit 367