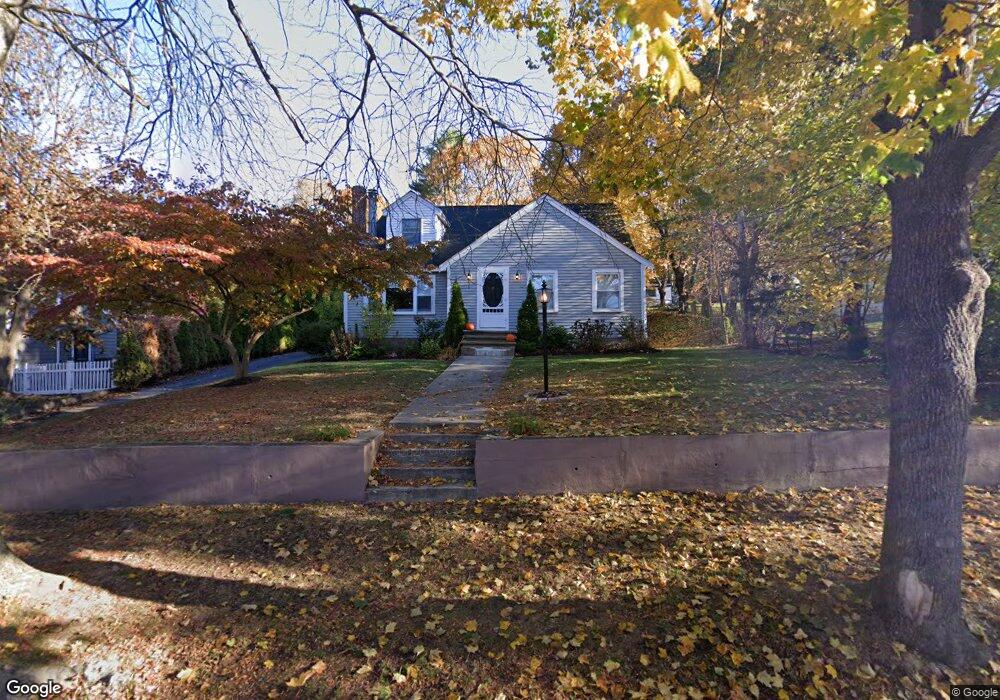
15 Dunster Ln Winchester, MA 01890
West Side NeighborhoodEstimated Value: $905,000 - $1,137,000
3
Beds
1
Bath
1,663
Sq Ft
$620/Sq Ft
Est. Value
About This Home
This home is located at 15 Dunster Ln, Winchester, MA 01890 and is currently estimated at $1,030,697, approximately $619 per square foot. 15 Dunster Ln is a home located in Middlesex County with nearby schools including Vinson-Owen Elementary School, McCall Middle School, and Winchester High School.
Ownership History
Date
Name
Owned For
Owner Type
Purchase Details
Closed on
Oct 24, 1990
Sold by
Dunster Lane Rt
Bought by
Viglas James
Current Estimated Value
Home Financials for this Owner
Home Financials are based on the most recent Mortgage that was taken out on this home.
Original Mortgage
$95,000
Interest Rate
10.08%
Mortgage Type
Purchase Money Mortgage
Create a Home Valuation Report for This Property
The Home Valuation Report is an in-depth analysis detailing your home's value as well as a comparison with similar homes in the area
Home Values in the Area
Average Home Value in this Area
Purchase History
| Date | Buyer | Sale Price | Title Company |
|---|---|---|---|
| Viglas James | $165,000 | -- |
Source: Public Records
Mortgage History
| Date | Status | Borrower | Loan Amount |
|---|---|---|---|
| Open | Viglas James | $125,000 | |
| Closed | Viglas James | $25,000 | |
| Closed | Viglas James | $95,000 | |
| Previous Owner | Viglas James | $168,000 |
Source: Public Records
Tax History Compared to Growth
Tax History
| Year | Tax Paid | Tax Assessment Tax Assessment Total Assessment is a certain percentage of the fair market value that is determined by local assessors to be the total taxable value of land and additions on the property. | Land | Improvement |
|---|---|---|---|---|
| 2025 | $100 | $897,300 | $619,200 | $278,100 |
| 2024 | $10,154 | $896,200 | $619,200 | $277,000 |
| 2023 | $9,809 | $831,300 | $567,600 | $263,700 |
| 2022 | $8,678 | $693,700 | $430,000 | $263,700 |
| 2021 | $8,828 | $685,100 | $421,400 | $263,700 |
| 2020 | $8,488 | $685,100 | $421,400 | $263,700 |
| 2019 | $7,463 | $616,300 | $352,600 | $263,700 |
| 2018 | $7,193 | $590,100 | $335,400 | $254,700 |
| 2017 | $6,814 | $554,900 | $318,200 | $236,700 |
| 2016 | $6,376 | $545,900 | $318,200 | $227,700 |
| 2015 | $6,131 | $505,000 | $288,100 | $216,900 |
| 2014 | $5,812 | $459,100 | $249,400 | $209,700 |
Source: Public Records
Map
Nearby Homes