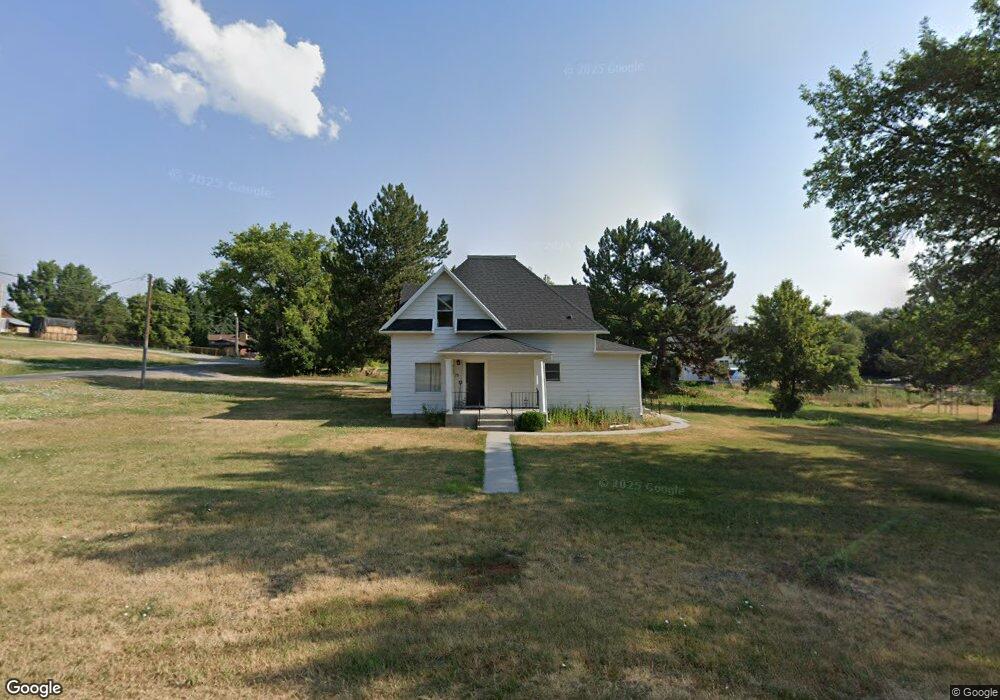
15 E 100 N Clarkston, UT 84305
Estimated Value: $312,794 - $389,000
Studio
--
Bath
1,673
Sq Ft
$213/Sq Ft
Est. Value
About This Home
This home is located at 15 E 100 N, Clarkston, UT 84305 and is currently estimated at $356,949, approximately $213 per square foot. 15 E 100 N is a home with nearby schools including Lewiston School, White Pine Middle School, and North Cache Middle School.
Ownership History
Date
Name
Owned For
Owner Type
Purchase Details
Closed on
Aug 22, 2022
Sold by
Clark Taylor Z and Clark Michelle
Bought by
Maven Properties Llc
Current Estimated Value
Purchase Details
Closed on
May 13, 2019
Sold by
Clark Taylor Z and Clark Michelle
Bought by
Clark Taylor Z and Clark Michelle
Purchase Details
Closed on
May 8, 2013
Sold by
Clark Taylor Z and Ricks Michelle
Bought by
Clark Taylor Z and Clark Michelle
Home Financials for this Owner
Home Financials are based on the most recent Mortgage that was taken out on this home.
Original Mortgage
$95,000
Interest Rate
3.5%
Mortgage Type
New Conventional
Purchase Details
Closed on
May 11, 2010
Sold by
Goodey Leroy R
Bought by
Clark Taylor Z and Ricks Michelle
Home Financials for this Owner
Home Financials are based on the most recent Mortgage that was taken out on this home.
Original Mortgage
$120,280
Interest Rate
5.04%
Mortgage Type
FHA
Create a Home Valuation Report for This Property
The Home Valuation Report is an in-depth analysis detailing your home's value as well as a comparison with similar homes in the area
Purchase History
| Date | Buyer | Sale Price | Title Company |
|---|---|---|---|
| Maven Properties Llc | -- | Northern Title Company | |
| Clark Taylor Z | -- | Northern Title Company | |
| Clark Taylor Z | -- | Northern Title Company | |
| Clark Taylor Z | -- | Northern Title Company | |
| Clark Taylor Z | -- | Cache Title Company |
Source: Public Records
Mortgage History
| Date | Status | Borrower | Loan Amount |
|---|---|---|---|
| Previous Owner | Clark Taylor Z | $95,000 | |
| Previous Owner | Clark Taylor Z | $120,280 |
Source: Public Records
Tax History
| Year | Tax Paid | Tax Assessment Tax Assessment Total Assessment is a certain percentage of the fair market value that is determined by local assessors to be the total taxable value of land and additions on the property. | Land | Improvement |
|---|---|---|---|---|
| 2025 | $1,216 | $163,905 | $0 | $0 |
| 2023 | $1,347 | $171,150 | $0 | $0 |
| 2022 | $1,254 | $152,490 | $0 | $0 |
| 2021 | $886 | $159,312 | $28,000 | $131,312 |
| 2020 | $747 | $129,240 | $28,000 | $101,240 |
| 2019 | $886 | $143,690 | $43,450 | $100,240 |
| 2018 | $852 | $132,950 | $43,450 | $89,500 |
| 2017 | $833 | $68,810 | $0 | $0 |
| 2016 | $843 | $68,810 | $0 | $0 |
| 2015 | $843 | $68,810 | $0 | $0 |
| 2014 | $823 | $68,810 | $0 | $0 |
| 2013 | -- | $68,810 | $0 | $0 |
Source: Public Records
Map
Nearby Homes
- 53 W 200 S
- 43 E 300 S
- 13900 Dirty Head Rd
- 7300 W 8600 N
- 6350 W 9000 N
- 180 N 300 W
- 144 N 300 W Unit 13
- 141 N 300 W Unit 12
- 165 N 300 W Unit 11
- 172 N 300 W Unit 14
- 15 S 400 W
- 4860 W 12200 N Unit 3
- 115 N 100 W Unit 23
- 312 W 200 N Unit 10
- 222 W 200 N Unit 18
- 165 W 200 N
- 136 W 200 N Unit 21
- 244 W 200 N Unit 17
- 260 W 200 N Unit 16
- 158 W 200 N Unit 20
Your Personal Tour Guide
Ask me questions while you tour the home.