Estimated Value: $715,810 - $996,000
8
Beds
4
Baths
3,800
Sq Ft
$217/Sq Ft
Est. Value
About This Home
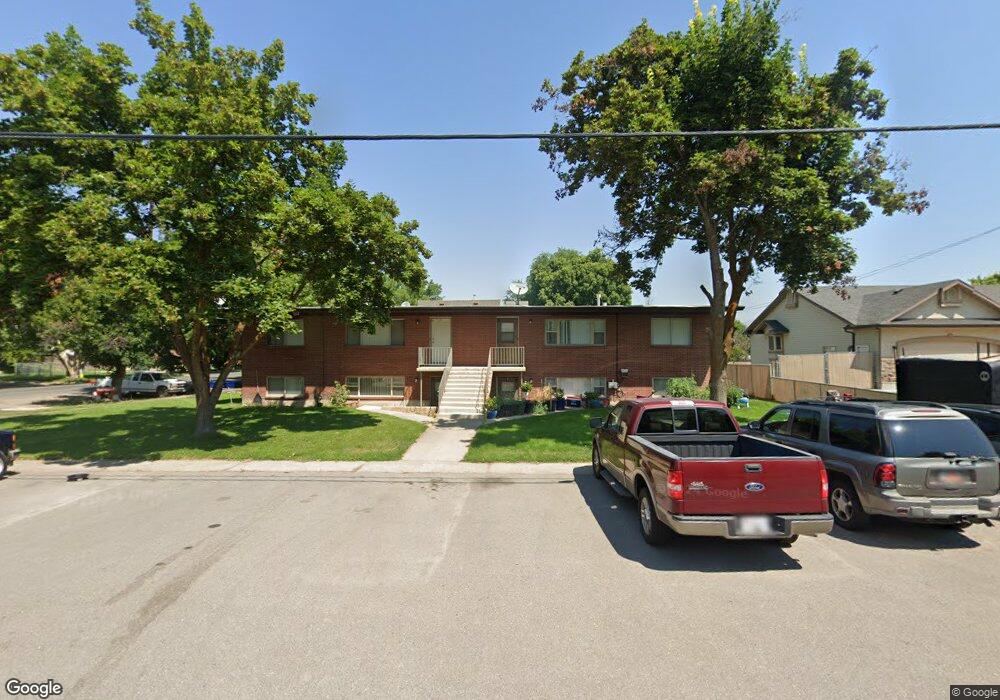
This home is located at 15 E 100 S, Hyrum, UT 84319 and is currently estimated at $823,453, approximately $216 per square foot. 15 E 100 S is a home located in Cache County with nearby schools including Lincoln School, South Cache Middle School, and Mountain Crest High School.
Ownership History
Date
Name
Owned For
Owner Type
Purchase Details
Closed on
Feb 9, 2022
Sold by
Leishman Family Trust
Bought by
15 E 100 S Hyrum Llc
Current Estimated Value
Purchase Details
Closed on
Jan 27, 2022
Sold by
Leishman Family Trust
Bought by
Leishman Michael L and Leishman Connie M
Purchase Details
Closed on
Mar 26, 2019
Sold by
Leishman Michael L and Leishman Connie M
Bought by
The Leishman Family Trust
Purchase Details
Closed on
Jul 6, 2007
Sold by
Cache Enterprises & Realty Inc
Bought by
Leishman Michael L and Leishman Connie M
Create a Home Valuation Report for This Property
The Home Valuation Report is an in-depth analysis detailing your home's value as well as a comparison with similar homes in the area
Home Values in the Area
Average Home Value in this Area
Purchase History
| Date | Buyer | Sale Price | Title Company |
|---|---|---|---|
| 15 E 100 S Hyrum Llc | -- | Pinnacle Title | |
| University Impact | -- | Pinnacle Title | |
| Leishman Michael L | -- | Accommodation/Courtesy Recordi | |
| The Leishman Family Trust | -- | None Available | |
| Leishman Michael L | -- | Northern Title Company |
Source: Public Records
Tax History
| Year | Tax Paid | Tax Assessment Tax Assessment Total Assessment is a certain percentage of the fair market value that is determined by local assessors to be the total taxable value of land and additions on the property. | Land | Improvement |
|---|---|---|---|---|
| 2025 | $2,330 | $608,140 | $215,000 | $393,140 |
| 2023 | $2,255 | $525,540 | $132,400 | $393,140 |
| 2022 | $2,353 | $525,540 | $132,400 | $393,140 |
| 2021 | $2,587 | $489,800 | $132,400 | $357,400 |
| 2020 | $1,650 | $293,000 | $90,000 | $203,000 |
| 2019 | $1,754 | $293,000 | $90,000 | $203,000 |
| 2018 | $1,410 | $227,736 | $65,000 | $162,736 |
| 2017 | $1,380 | $115,665 | $0 | $0 |
| 2016 | $1,411 | $115,665 | $0 | $0 |
| 2015 | $1,415 | $115,665 | $0 | $0 |
| 2014 | $1,383 | $115,665 | $0 | $0 |
| 2013 | -- | $102,790 | $0 | $0 |
Source: Public Records
Map
Nearby Homes
- 45 N Center St
- 28 N 100 E
- 127 W Main St
- 284 W 20 N
- 828 W 70 N
- 798 W 70 N Unit 85
- 831 W 70 N Unit 91
- 828 W 70 N Unit 87
- 817 W 70 N
- 817 W 70 N Unit 92
- 808 W 70 N Unit 86
- 844 W 70 N Unit 88
- 808 W 70 N
- 6 N 400 W
- 431 E 100 S
- 265 S 400 W Unit 2
- 255 S 400 W Unit 1
- 493 Valley View Dr
- 350 E 300 N
- 325 W 300 N
Your Personal Tour Guide
Ask me questions while you tour the home.