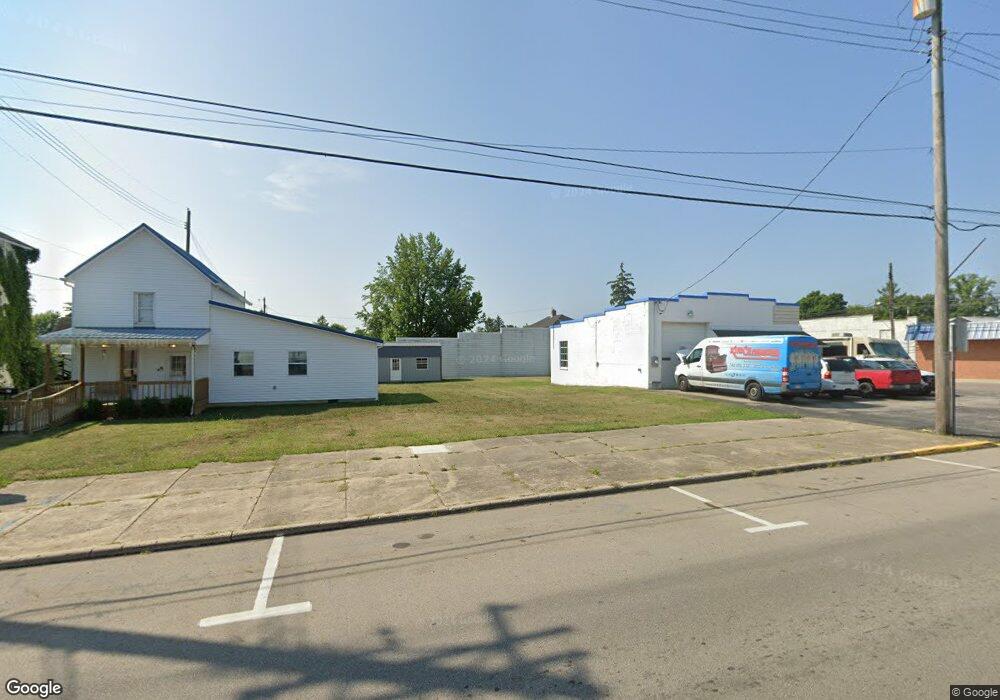
15 E Front St New Holland, OH 43145
Estimated Value: $66,000 - $159,000
2
Beds
1
Bath
2,656
Sq Ft
$44/Sq Ft
Est. Value
About This Home
This home is located at 15 E Front St, New Holland, OH 43145 and is currently estimated at $116,667, approximately $43 per square foot. 15 E Front St is a home located in Pickaway County with nearby schools including Miami Trace Elementary School, Miami Trace Middle School, and Miami Trace High School.
Ownership History
Date
Name
Owned For
Owner Type
Purchase Details
Closed on
Jan 18, 2023
Sold by
Jewell Michael C
Bought by
Dove Beverly R
Current Estimated Value
Purchase Details
Closed on
Dec 17, 2021
Sold by
Jewell Michael C
Bought by
Jewell Michael C
Purchase Details
Closed on
Jul 8, 2021
Sold by
Ingram Carrie
Bought by
Dove Beverly R
Purchase Details
Closed on
Sep 28, 2007
Sold by
Kirkpatrick Randy C and Kirkpatrick Peggy D
Bought by
Ingram Carrie
Home Financials for this Owner
Home Financials are based on the most recent Mortgage that was taken out on this home.
Original Mortgage
$45,600
Interest Rate
6.49%
Mortgage Type
Commercial
Purchase Details
Closed on
May 16, 2006
Sold by
Kirkpatrick Randy C
Bought by
Kirkpatrick Randy C and Kirkpatrick Danny E
Purchase Details
Closed on
Dec 20, 1993
Sold by
Kirkpatrick Ansel W
Bought by
Kirkpatrick Mary L
Create a Home Valuation Report for This Property
The Home Valuation Report is an in-depth analysis detailing your home's value as well as a comparison with similar homes in the area
Purchase History
| Date | Buyer | Sale Price | Title Company |
|---|---|---|---|
| Dove Beverly R | -- | -- | |
| Dove Beverly R | -- | None Listed On Document | |
| Jewell Michael C | -- | None Available | |
| Jewell Michael J | -- | Washington Title | |
| Dove Beverly R | $35,000 | None Available | |
| Ingram Carrie | $55,000 | Attorney | |
| Kirkpatrick Randy C | -- | None Available | |
| Kirkpatrick Mary L | -- | -- |
Source: Public Records
Mortgage History
| Date | Status | Borrower | Loan Amount |
|---|---|---|---|
| Previous Owner | Ingram Carrie | $45,600 |
Source: Public Records
Tax History
| Year | Tax Paid | Tax Assessment Tax Assessment Total Assessment is a certain percentage of the fair market value that is determined by local assessors to be the total taxable value of land and additions on the property. | Land | Improvement |
|---|---|---|---|---|
| 2024 | $1,988 | $36,860 | $3,530 | $33,330 |
| 2023 | $1,564 | $36,860 | $3,530 | $33,330 |
| 2022 | $1,154 | $19,410 | $2,770 | $16,640 |
| 2021 | $1,079 | $19,410 | $2,770 | $16,640 |
| 2020 | $1,060 | $19,410 | $2,770 | $16,640 |
| 2019 | $1,300 | $18,510 | $2,770 | $15,740 |
| 2018 | $1,173 | $18,510 | $2,770 | $15,740 |
| 2017 | $1,052 | $18,510 | $2,770 | $15,740 |
| 2016 | $1,285 | $18,020 | $2,730 | $15,290 |
| 2015 | $1,549 | $18,020 | $2,730 | $15,290 |
| 2014 | $1,534 | $18,020 | $2,730 | $15,290 |
| 2013 | $1,551 | $18,020 | $2,730 | $15,290 |
Source: Public Records
Map
Nearby Homes
- 112 E School St
- 8 Allen Ave
- 13525 Clarksburg Pike
- 24136 Egypt Pike
- 2922 SE Good Hope New Holland Rd SE
- 9948 Glaze Rd
- 7764 Glaze Rd
- 48 Deer Haven Ct NE
- 5181 Robinson Rd SE
- 10673 US Highway 22 Unit W
- 10905 6th St
- 10936 6th St
- 17310 High St
- 10868 Main St
- 0 State Route 138
- 19763 Clarks Run Rd
- 16270 Cook Yankeetown Rd NE
- 0 Lowes Blvd
- 716 Deer Creek Rd
- 548 Douglas Rd
- 27 E Front St
- 33 E Front St
- 26 E Front St
- 42 S Main St
- 20 N Main St
- Lot 20 Egypt Pike
- Lot 18 Egypt Pike
- 35 E Front St
- 30 E Front St
- 17 East St
- 39 E Front St
- 3 Egypt Pike Unit Tract 3
- 23 E Front St
- 34 S Main St
- Lot 21 Egypt Pike
- Lot 39 Egypt Pike
- 25 S East St
- 14 East St
- 25 W Front St
- 46 S Main St Unit 40
Your Personal Tour Guide
Ask me questions while you tour the home.