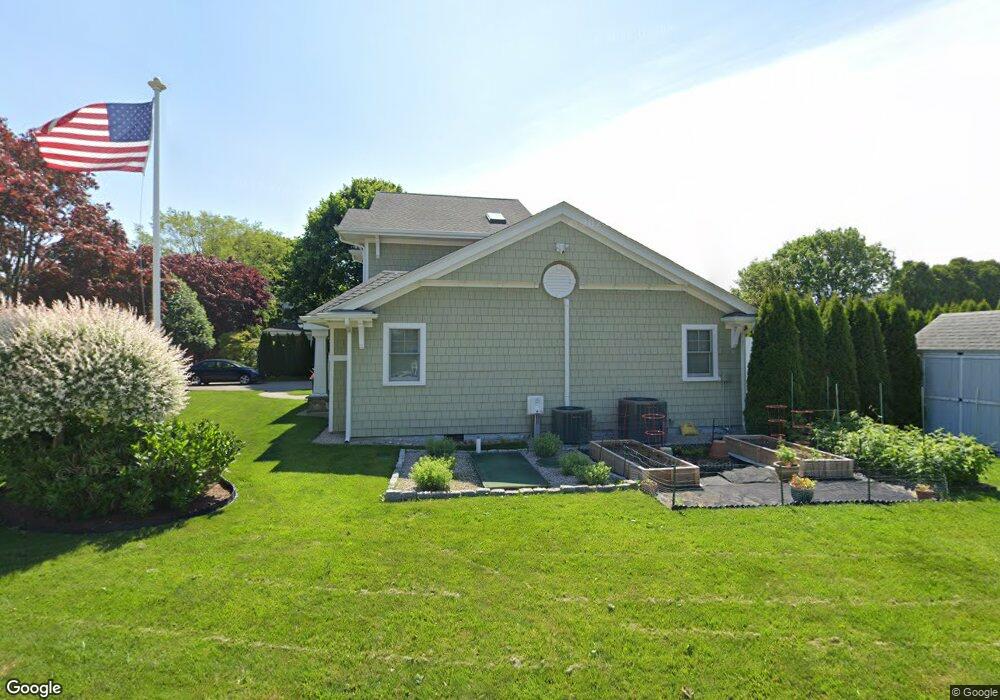
15 Egret Ln Westerly, RI 02891
Estimated Value: $1,216,000 - $1,822,000
3
Beds
3
Baths
3,040
Sq Ft
$511/Sq Ft
Est. Value
About This Home
This home is located at 15 Egret Ln, Westerly, RI 02891 and is currently estimated at $1,554,803, approximately $511 per square foot. 15 Egret Ln is a home located in Washington County with nearby schools including Westerly High School.
Ownership History
Date
Name
Owned For
Owner Type
Purchase Details
Closed on
Apr 15, 2025
Sold by
Powers Thomas and Ellingwood Nancy M
Bought by
Powers
Current Estimated Value
Purchase Details
Closed on
Jun 13, 2017
Sold by
Powers Thomas
Bought by
Powers Thomas and Ellingwood Nancy M
Purchase Details
Closed on
Apr 18, 1997
Sold by
Massung Phyllis
Bought by
Powers Thomas and Ellingwood Nancy M
Home Financials for this Owner
Home Financials are based on the most recent Mortgage that was taken out on this home.
Original Mortgage
$100,000
Interest Rate
7.76%
Create a Home Valuation Report for This Property
The Home Valuation Report is an in-depth analysis detailing your home's value as well as a comparison with similar homes in the area
Home Values in the Area
Average Home Value in this Area
Purchase History
| Date | Buyer | Sale Price | Title Company |
|---|---|---|---|
| Powers | -- | None Available | |
| Powers | -- | None Available | |
| Powers Thomas | -- | -- | |
| Powers Thomas | $135,000 | -- |
Source: Public Records
Mortgage History
| Date | Status | Borrower | Loan Amount |
|---|---|---|---|
| Previous Owner | Powers Thomas | $417,000 | |
| Previous Owner | Powers Thomas | $300,000 | |
| Previous Owner | Powers Thomas | $75,500 | |
| Previous Owner | Powers Thomas | $100,000 |
Source: Public Records
Tax History Compared to Growth
Tax History
| Year | Tax Paid | Tax Assessment Tax Assessment Total Assessment is a certain percentage of the fair market value that is determined by local assessors to be the total taxable value of land and additions on the property. | Land | Improvement |
|---|---|---|---|---|
| 2025 | $8,070 | $1,135,000 | $444,200 | $690,800 |
| 2024 | $8,913 | $908,600 | $317,200 | $591,400 |
| 2023 | $8,512 | $884,800 | $317,200 | $567,600 |
| 2022 | $8,459 | $884,800 | $317,200 | $567,600 |
| 2021 | $7,405 | $642,800 | $195,500 | $447,300 |
| 2020 | $7,270 | $642,800 | $195,500 | $447,300 |
| 2019 | $7,199 | $642,800 | $195,500 | $447,300 |
| 2018 | $7,325 | $616,600 | $195,500 | $421,100 |
| 2017 | $6,043 | $521,400 | $194,600 | $326,800 |
| 2016 | $6,090 | $521,400 | $194,600 | $326,800 |
| 2015 | $5,790 | $535,100 | $198,500 | $336,600 |
| 2014 | $5,693 | $535,100 | $198,500 | $336,600 |
Source: Public Records
Map
Nearby Homes