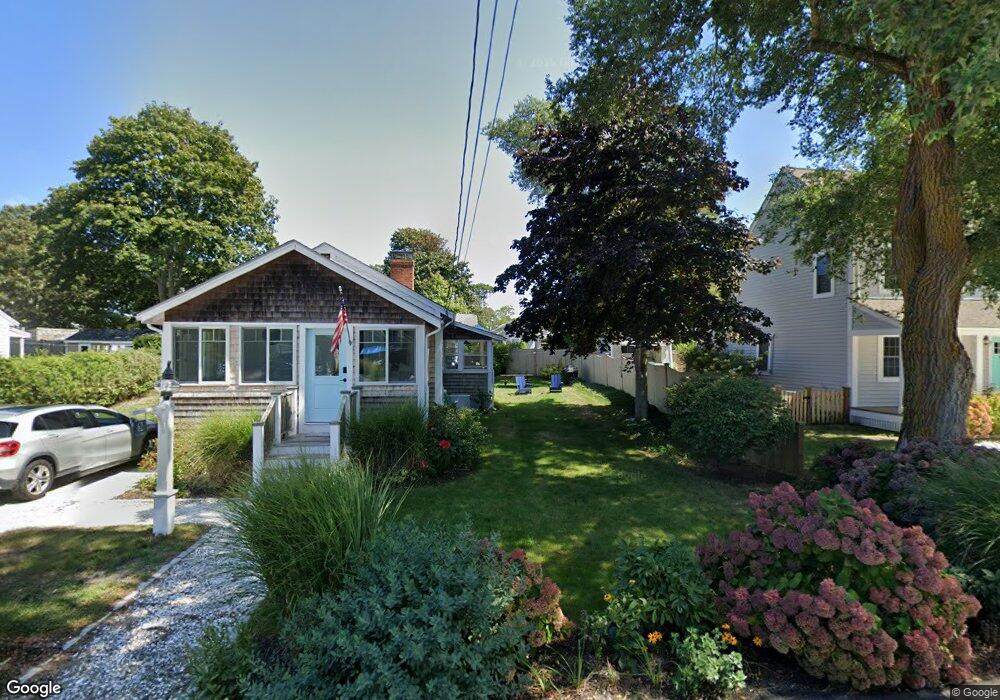
15 Eldridge Ln Dennis Port, MA 02639
Dennis Port NeighborhoodEstimated Value: $616,385 - $683,000
3
Beds
1
Bath
650
Sq Ft
$1,013/Sq Ft
Est. Value
About This Home
This home is located at 15 Eldridge Ln, Dennis Port, MA 02639 and is currently estimated at $658,346, approximately $1,012 per square foot. 15 Eldridge Ln is a home located in Barnstable County with nearby schools including Dennis-Yarmouth Regional High School and St. Pius X. School.
Ownership History
Date
Name
Owned For
Owner Type
Purchase Details
Closed on
Jul 16, 2019
Sold by
Sanborn John C
Bought by
John C Sanborn Ret 2019
Current Estimated Value
Purchase Details
Closed on
Jan 13, 2003
Sold by
Fontinha Anthony J and Fontinha Ernestine I
Bought by
Sanborn John C
Home Financials for this Owner
Home Financials are based on the most recent Mortgage that was taken out on this home.
Original Mortgage
$216,000
Interest Rate
6.19%
Mortgage Type
Purchase Money Mortgage
Create a Home Valuation Report for This Property
The Home Valuation Report is an in-depth analysis detailing your home's value as well as a comparison with similar homes in the area
Home Values in the Area
Average Home Value in this Area
Purchase History
| Date | Buyer | Sale Price | Title Company |
|---|---|---|---|
| John C Sanborn Ret 2019 | -- | -- | |
| Sanborn John C | $240,000 | -- |
Source: Public Records
Mortgage History
| Date | Status | Borrower | Loan Amount |
|---|---|---|---|
| Previous Owner | Sanborn John C | $216,000 | |
| Previous Owner | Sanborn John C | $35,000 |
Source: Public Records
Tax History
| Year | Tax Paid | Tax Assessment Tax Assessment Total Assessment is a certain percentage of the fair market value that is determined by local assessors to be the total taxable value of land and additions on the property. | Land | Improvement |
|---|---|---|---|---|
| 2025 | $2,589 | $598,000 | $301,800 | $296,200 |
| 2024 | $2,454 | $558,900 | $290,200 | $268,700 |
| 2023 | $2,373 | $508,100 | $263,800 | $244,300 |
| 2022 | $2,190 | $391,100 | $208,000 | $183,100 |
| 2021 | $2,141 | $355,100 | $203,900 | $151,200 |
| 2020 | $2,080 | $341,000 | $203,900 | $137,100 |
| 2019 | $4,661 | $338,600 | $217,000 | $121,600 |
| 2018 | $3,323 | $315,600 | $206,600 | $109,000 |
| 2017 | $1,836 | $298,500 | $193,100 | $105,400 |
| 2016 | $1,770 | $271,100 | $182,100 | $89,000 |
| 2015 | $1,735 | $271,100 | $182,100 | $89,000 |
| 2014 | $1,651 | $260,000 | $171,000 | $89,000 |
Source: Public Records
Map
Nearby Homes
- 9 Chase Ave Unit 6
- 1 E Belmont Unit 513
- 1 E Belmont Unit 630
- 1 E Belmont Unit 22
- 1 E Belmont Unit 541
- 1 Belmont Rd Unit 22
- 1 Belmont Rd Unit 630
- 1 Belmont Rd Unit 541
- 1 Belmont Rd Unit 542
- 1 Belmont Rd Unit 513
- 22 Ferncliff Rd
- 59 Sea St
- 104 Toms Path
- 104 Toms Path
- 41 Center St
- 37-A Beach Hills Rd
- 37 Beach Hills Rd
- 10 Candlewood Ln Unit 2
- 10 Candlewood Ln Unit 2-10
- 12 Candlewood Ln Unit 2-6
Your Personal Tour Guide
Ask me questions while you tour the home.