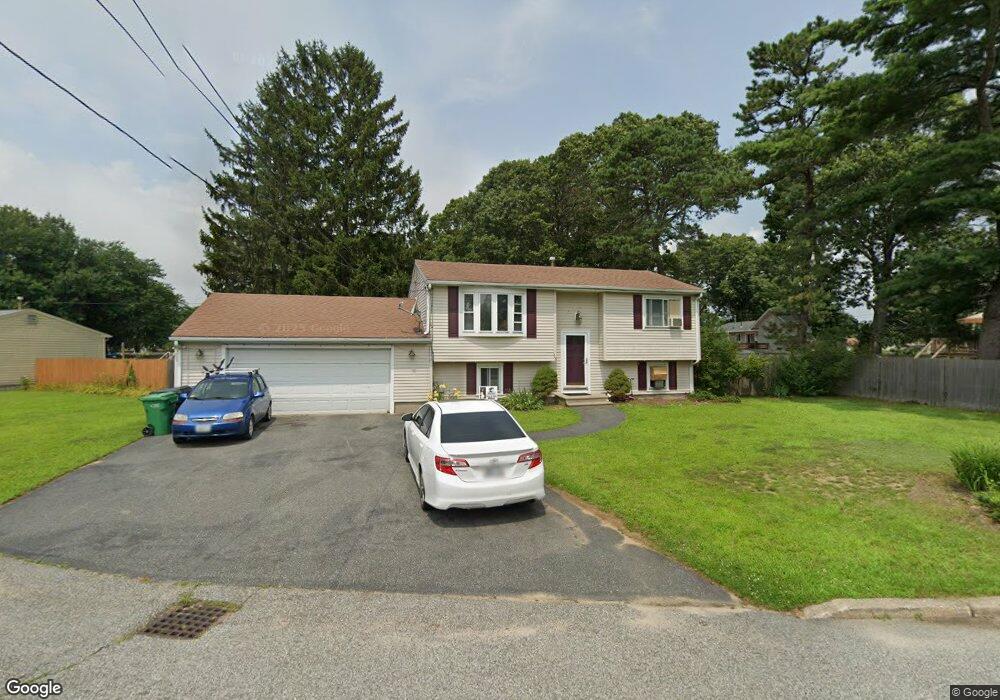
15 Elite Dr Warwick, RI 02889
Hoxie NeighborhoodEstimated Value: $387,000 - $402,000
2
Beds
2
Baths
1,122
Sq Ft
$349/Sq Ft
Est. Value
About This Home
This home is located at 15 Elite Dr, Warwick, RI 02889 and is currently estimated at $391,741, approximately $349 per square foot. 15 Elite Dr is a home located in Kent County with nearby schools including Saint Kevin School and Bishop Hendricken High School.
Ownership History
Date
Name
Owned For
Owner Type
Purchase Details
Closed on
Oct 3, 2018
Sold by
Guzman Dennie L and Rivers Elizabeth M
Bought by
Guzman Dennie L
Current Estimated Value
Purchase Details
Closed on
Jan 12, 2009
Sold by
Hsbc Bank Usa
Bought by
Guzman Dennie L and Rivera Elizabeth M
Home Financials for this Owner
Home Financials are based on the most recent Mortgage that was taken out on this home.
Original Mortgage
$149,850
Interest Rate
5.99%
Mortgage Type
Purchase Money Mortgage
Purchase Details
Closed on
Sep 13, 2005
Sold by
Mistofsky Brett
Bought by
Cabral Joseph
Home Financials for this Owner
Home Financials are based on the most recent Mortgage that was taken out on this home.
Original Mortgage
$224,000
Interest Rate
5.79%
Mortgage Type
Purchase Money Mortgage
Create a Home Valuation Report for This Property
The Home Valuation Report is an in-depth analysis detailing your home's value as well as a comparison with similar homes in the area
Home Values in the Area
Average Home Value in this Area
Purchase History
| Date | Buyer | Sale Price | Title Company |
|---|---|---|---|
| Guzman Dennie L | -- | -- | |
| Guzman Dennie L | $157,750 | -- | |
| Cabral Joseph | $280,000 | -- |
Source: Public Records
Mortgage History
| Date | Status | Borrower | Loan Amount |
|---|---|---|---|
| Previous Owner | Cabral Joseph | $149,850 | |
| Previous Owner | Cabral Joseph | $224,000 | |
| Previous Owner | Cabral Joseph | $56,000 | |
| Previous Owner | Cabral Joseph | $79,170 |
Source: Public Records
Tax History
| Year | Tax Paid | Tax Assessment Tax Assessment Total Assessment is a certain percentage of the fair market value that is determined by local assessors to be the total taxable value of land and additions on the property. | Land | Improvement |
|---|---|---|---|---|
| 2025 | $4,705 | $370,500 | $113,700 | $256,800 |
| 2024 | $4,575 | $316,200 | $98,800 | $217,400 |
| 2023 | $4,487 | $316,200 | $98,800 | $217,400 |
| 2022 | $4,373 | $233,500 | $69,300 | $164,200 |
| 2021 | $4,373 | $233,500 | $69,300 | $164,200 |
| 2020 | $4,373 | $233,500 | $69,300 | $164,200 |
| 2019 | $4,373 | $233,500 | $69,300 | $164,200 |
| 2018 | $3,725 | $179,100 | $69,300 | $109,800 |
| 2017 | $3,625 | $179,100 | $69,300 | $109,800 |
| 2016 | $3,625 | $179,100 | $69,300 | $109,800 |
| 2015 | $3,631 | $175,000 | $68,600 | $106,400 |
| 2014 | $3,511 | $175,000 | $68,600 | $106,400 |
| 2013 | $3,463 | $175,000 | $68,600 | $106,400 |
Source: Public Records
Map
Nearby Homes
- 700 Sandy Ln Unit 16
- 700 Sandy Ln Unit 3
- 700 Sandy Ln Unit 5
- 700 Sandy Ln Unit 19
- 700 Sandy Ln Unit 4
- 700 Sandy Ln Unit 20
- 700 Sandy Ln Unit 2
- 207 Stillwater Dr
- 86 Glen Dr
- 9 Kenneth Ave
- 68 Alfred St
- 211 Pinnery Ave
- 72 Hollis Ave
- 38 Bowman Dr
- 112 Old Warwick Ave
- 266 Vineyard Rd
- 64 Ormsby Ave
- 54 Ansonia Rd
- 70 Turner St Unit F1
- 70 Turner St Unit E-6
Your Personal Tour Guide
Ask me questions while you tour the home.