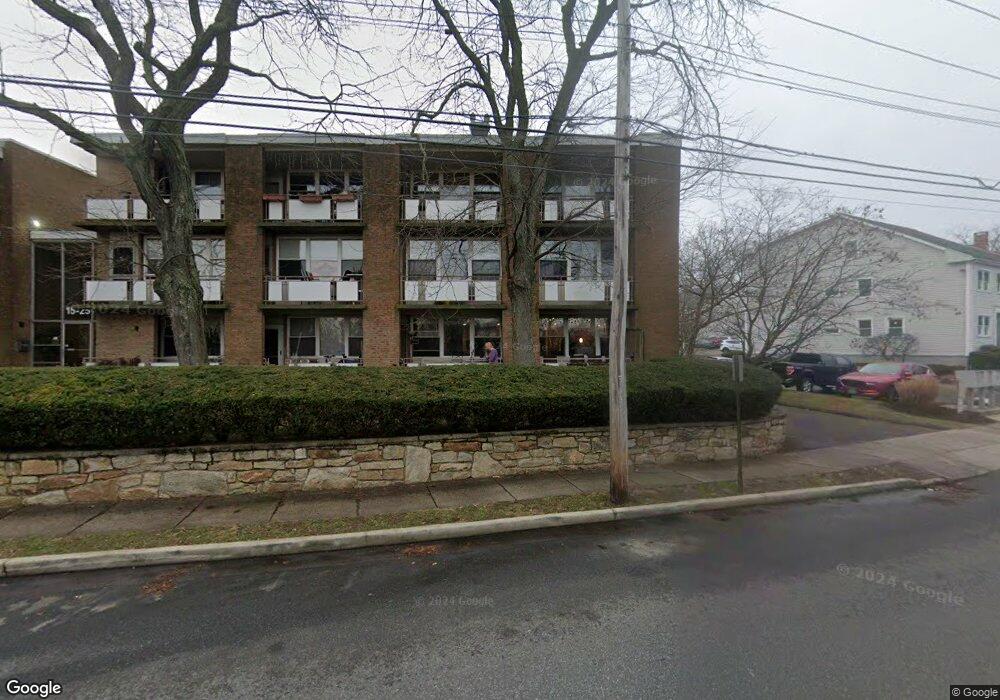
15 Ellsworth St Unit 11 Bridgeport, CT 06605
Black Rock NeighborhoodEstimated Value: $151,000 - $196,000
1
Bed
1
Bath
384
Sq Ft
$426/Sq Ft
Est. Value
About This Home
This home is located at 15 Ellsworth St Unit 11, Bridgeport, CT 06605 and is currently estimated at $163,679, approximately $426 per square foot. 15 Ellsworth St Unit 11 is a home located in Fairfield County with nearby schools including Black Rock School, Bassick High School, and Great Oaks Charter School Bridgeport.
Ownership History
Date
Name
Owned For
Owner Type
Purchase Details
Closed on
Dec 12, 2016
Sold by
Veterans Helping Veter
Bought by
Attar Ryan
Current Estimated Value
Purchase Details
Closed on
Nov 23, 2015
Sold by
Chfa
Bought by
Lucien Investors Llc
Purchase Details
Closed on
Jan 21, 2014
Sold by
Samuel Dimeo
Bought by
Chfa
Purchase Details
Closed on
Jun 1, 2005
Sold by
Redbrick Partners Fund
Bought by
Dimeo Samuel
Home Financials for this Owner
Home Financials are based on the most recent Mortgage that was taken out on this home.
Original Mortgage
$79,400
Interest Rate
5.83%
Purchase Details
Closed on
Aug 22, 2003
Sold by
Mouinho Manuel
Bought by
Redbrick Prtnrs Fund L
Purchase Details
Closed on
Feb 23, 1994
Sold by
Curry Carolanne
Bought by
Glenport Main Corp
Create a Home Valuation Report for This Property
The Home Valuation Report is an in-depth analysis detailing your home's value as well as a comparison with similar homes in the area
Home Values in the Area
Average Home Value in this Area
Purchase History
| Date | Buyer | Sale Price | Title Company |
|---|---|---|---|
| Attar Ryan | $60,500 | -- | |
| Attar Ryan | $60,500 | -- | |
| Lucien Investors Llc | $38,500 | -- | |
| Lucien Investors Llc | $38,500 | -- | |
| Chfa | -- | -- | |
| Chfa | -- | -- | |
| Dimeo Samuel | $82,400 | -- | |
| Dimeo Samuel | $82,400 | -- | |
| Redbrick Prtnrs Fund L | $24,213 | -- | |
| Redbrick Prtnrs Fund L | $24,213 | -- | |
| Glenport Main Corp | $5,000 | -- | |
| Glenport Main Corp | $5,000 | -- |
Source: Public Records
Mortgage History
| Date | Status | Borrower | Loan Amount |
|---|---|---|---|
| Previous Owner | Glenport Main Corp | $79,400 |
Source: Public Records
Tax History Compared to Growth
Tax History
| Year | Tax Paid | Tax Assessment Tax Assessment Total Assessment is a certain percentage of the fair market value that is determined by local assessors to be the total taxable value of land and additions on the property. | Land | Improvement |
|---|---|---|---|---|
| 2025 | $1,988 | $45,750 | $0 | $45,750 |
| 2024 | $1,988 | $45,750 | $0 | $45,750 |
| 2023 | $1,988 | $45,750 | $0 | $45,750 |
| 2022 | $1,988 | $45,750 | $0 | $45,750 |
| 2021 | $1,988 | $45,750 | $0 | $45,750 |
| 2020 | $2,349 | $43,510 | $0 | $43,510 |
| 2019 | $2,349 | $43,510 | $0 | $43,510 |
| 2018 | $2,366 | $43,510 | $0 | $43,510 |
| 2017 | $2,366 | $43,510 | $0 | $43,510 |
| 2016 | $2,366 | $43,510 | $0 | $43,510 |
| 2015 | $2,504 | $59,330 | $0 | $59,330 |
| 2014 | $2,504 | $59,330 | $0 | $59,330 |
Source: Public Records
Map
Nearby Homes
- 65 Ellsworth St Unit 302
- 69 Ellsworth St Unit 102
- 48 Bywater Ln Unit 48
- 222 Ellsworth St
- 20 Haddon St Unit 3
- 26 Rowsley St Unit 3
- 2773 Fairfield Ave Unit 3
- 23 Harborview Place
- 185 Shell St
- 51 Princeton St
- 320 Lake Ave
- 506 Courtland Ave Unit 508
- 363 Lake Ave
- 80 Fox St
- 166 Alfred St
- 105 Scofield Ave
- 165 Bennett St
- 855 Brewster St Unit 857
- 115 Balmforth St
- 167 Scofield Ave
- 15 Ellsworth St Unit 6
- 15 Ellsworth St Unit 15
- 15 Ellsworth St Unit 30
- 15 Ellsworth St Unit 29
- 15 Ellsworth St Unit 28
- 15 Ellsworth St Unit 27
- 15 Ellsworth St Unit 26
- 15 Ellsworth St Unit 24
- 15 Ellsworth St Unit 23
- 15 Ellsworth St Unit 21
- 15 Ellsworth St Unit 20
- 15 Ellsworth St Unit 19
- 15 Ellsworth St Unit 18
- 15 Ellsworth St Unit 17
- 15 Ellsworth St Unit 16
- 15 Ellsworth St Unit 14
- 15 Ellsworth St Unit 13
- 15 Ellsworth St Unit 12
- 15 Ellsworth St Unit 10
- 15 Ellsworth St Unit 9