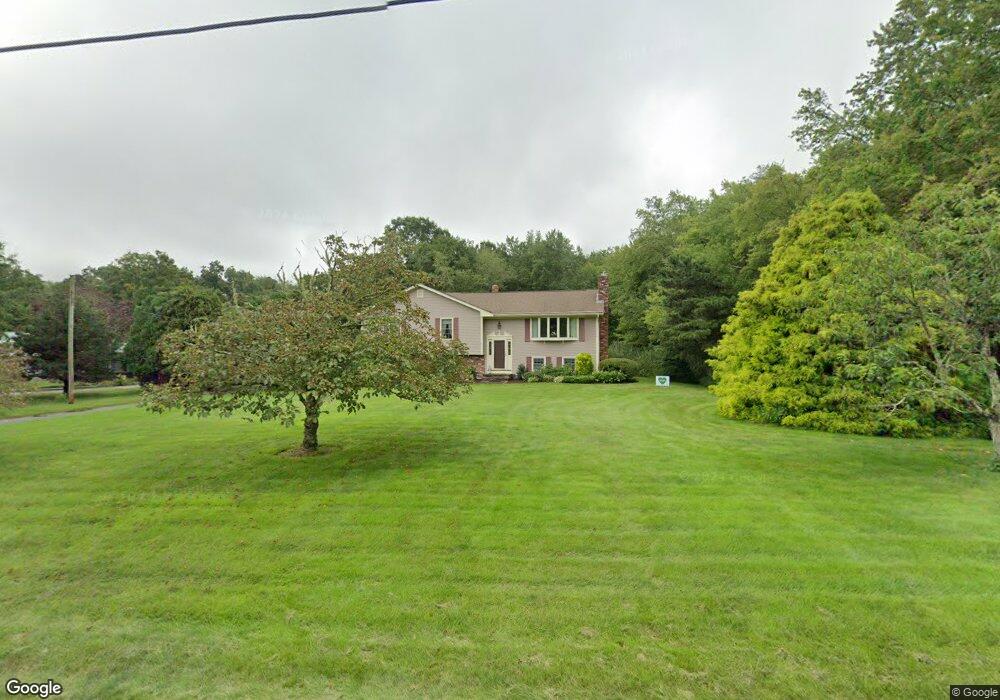
15 Fallon Dr Westport, MA 02790
Head of Westport NeighborhoodEstimated Value: $580,069 - $979,000
2
Beds
--
Bath
1,408
Sq Ft
$529/Sq Ft
Est. Value
About This Home
This home is located at 15 Fallon Dr, Westport, MA 02790 and is currently estimated at $744,767, approximately $528 per square foot. 15 Fallon Dr is a home located in Bristol County with nearby schools including Alice A. Macomber Primary School, Westport Elementary School, and Westport Middle-High School.
Ownership History
Date
Name
Owned For
Owner Type
Purchase Details
Closed on
Jul 20, 2007
Sold by
Comstock Cecelia C and Comstock Lynwood R
Bought by
Comstock Irt and Comstock Cecelia C
Current Estimated Value
Purchase Details
Closed on
Feb 16, 1996
Sold by
Antonio Manuel and Antonio Dorothy A
Bought by
Comstock Lynwood R and Comstock Cecilia C
Home Financials for this Owner
Home Financials are based on the most recent Mortgage that was taken out on this home.
Original Mortgage
$35,000
Interest Rate
6.99%
Mortgage Type
Purchase Money Mortgage
Create a Home Valuation Report for This Property
The Home Valuation Report is an in-depth analysis detailing your home's value as well as a comparison with similar homes in the area
Home Values in the Area
Average Home Value in this Area
Purchase History
| Date | Buyer | Sale Price | Title Company |
|---|---|---|---|
| Comstock Irt | -- | -- | |
| Comstock Lynwood R | $195,000 | -- |
Source: Public Records
Mortgage History
| Date | Status | Borrower | Loan Amount |
|---|---|---|---|
| Previous Owner | Comstock Lynwood R | $35,000 | |
| Previous Owner | Comstock Lynwood R | $40,000 | |
| Previous Owner | Comstock Lynwood R | $84,000 |
Source: Public Records
Tax History
| Year | Tax Paid | Tax Assessment Tax Assessment Total Assessment is a certain percentage of the fair market value that is determined by local assessors to be the total taxable value of land and additions on the property. | Land | Improvement |
|---|---|---|---|---|
| 2025 | $3,893 | $522,500 | $218,200 | $304,300 |
| 2024 | $3,894 | $503,800 | $202,800 | $301,000 |
| 2023 | $3,749 | $459,400 | $193,500 | $265,900 |
| 2022 | $3,655 | $440,500 | $193,500 | $247,000 |
| 2021 | $3,655 | $424,000 | $176,600 | $247,400 |
| 2020 | $3,730 | $397,400 | $163,600 | $233,800 |
| 2019 | $3,362 | $367,100 | $151,000 | $216,100 |
| 2018 | $172 | $430,700 | $234,700 | $196,000 |
| 2017 | $181 | $445,100 | $253,500 | $191,600 |
| 2016 | $3,693 | $466,900 | $274,700 | $192,200 |
| 2015 | $3,417 | $430,900 | $256,000 | $174,900 |
Source: Public Records
Map
Nearby Homes
- 45 Marcotte Unit Lot 7
- 171 Pine Hill Rd
- 250 Main Rd
- 441 Old County Rd
- 612 Drift Rd
- 279 Fisher Rd
- 172 Fisher Rd
- 210 Charlotte White Rd
- 12 Old Pasture Ln
- 595 Old Westport Rd
- 27 Steven Ave
- 923 Drift Rd
- 26 Division Rd
- 6 Angel Ct
- 523 Old Westport Rd
- 350 Gifford Rd
- 920 Drift Rd
- 408 Hixbridge Rd
- 0 Sodom Rd Unit 73503512
- 343 American Legion Hwy
Your Personal Tour Guide
Ask me questions while you tour the home.