15 Fannin St Cave Spring, GA 30124
Estimated Value: $188,125 - $232,000
--
Bed
--
Bath
1,204
Sq Ft
$172/Sq Ft
Est. Value
About This Home
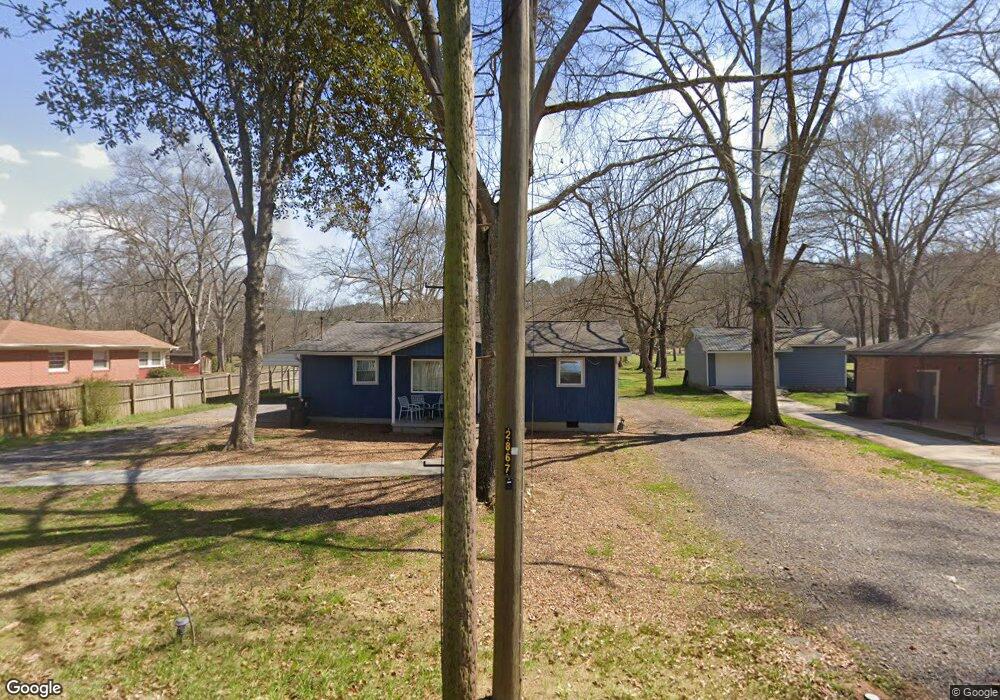
This home is located at 15 Fannin St, Cave Spring, GA 30124 and is currently estimated at $207,531, approximately $172 per square foot. 15 Fannin St is a home located in Floyd County with nearby schools including Coosa Middle School and Coosa High School.
Ownership History
Date
Name
Owned For
Owner Type
Purchase Details
Closed on
Feb 16, 2022
Sold by
Ingle Nilima
Bought by
Ingle Nilima and Paithane Deelip D
Current Estimated Value
Home Financials for this Owner
Home Financials are based on the most recent Mortgage that was taken out on this home.
Original Mortgage
$148,800
Interest Rate
3.69%
Mortgage Type
Cash
Purchase Details
Closed on
Oct 7, 2019
Sold by
Richmond Travis Lee Estate
Bought by
Sup Tacos Rentals Llc
Purchase Details
Closed on
Sep 1, 2000
Sold by
Susan Cromer and Susan Diane Gilham
Bought by
Richmond Travis L
Purchase Details
Closed on
May 17, 2000
Sold by
Cromer Mozelle Virginia Brock Estate Of
Bought by
Cromer Michael Norton and Martha Elle
Purchase Details
Closed on
May 16, 1969
Sold by
Weatherby Mrs Bee
Bought by
Cromer Grady L and Cromer Mozell B
Purchase Details
Closed on
Nov 1, 1968
Bought by
Weatherby Mrs Bee
Create a Home Valuation Report for This Property
The Home Valuation Report is an in-depth analysis detailing your home's value as well as a comparison with similar homes in the area
Home Values in the Area
Average Home Value in this Area
Purchase History
| Date | Buyer | Sale Price | Title Company |
|---|---|---|---|
| Ingle Nilima | -- | -- | |
| Ingle Nilima | $192,500 | -- | |
| Sup Tacos Rentals Llc | $25,000 | -- | |
| Richmond Travis L | $38,000 | -- | |
| Cromer Michael Norton | -- | -- | |
| Cromer Mozelle Virginia Brock Estat | -- | -- | |
| Susan Cromer | -- | -- | |
| Cromer Grady L | $9,000 | -- | |
| Weatherby Mrs Bee | $8,500 | -- |
Source: Public Records
Mortgage History
| Date | Status | Borrower | Loan Amount |
|---|---|---|---|
| Previous Owner | Ingle Nilima | $148,800 |
Source: Public Records
Tax History Compared to Growth
Tax History
| Year | Tax Paid | Tax Assessment Tax Assessment Total Assessment is a certain percentage of the fair market value that is determined by local assessors to be the total taxable value of land and additions on the property. | Land | Improvement |
|---|---|---|---|---|
| 2024 | $1,938 | $68,016 | $4,475 | $63,541 |
| 2023 | $1,789 | $69,401 | $4,068 | $65,333 |
| 2022 | $1,373 | $50,176 | $3,254 | $46,922 |
| 2021 | $1,180 | $42,345 | $3,254 | $39,091 |
| 2020 | $1,126 | $40,018 | $2,441 | $37,577 |
| 2019 | $449 | $16,179 | $2,441 | $13,738 |
| 2018 | $432 | $15,550 | $2,441 | $13,109 |
| 2017 | $344 | $15,370 | $2,441 | $12,929 |
| 2016 | $348 | $15,360 | $2,440 | $12,920 |
| 2015 | $341 | $15,360 | $2,440 | $12,920 |
| 2014 | $341 | $15,360 | $2,440 | $12,920 |
Source: Public Records
Map
Nearby Homes
- 22 River St SW
- 7 Herschel Mize Dr SW
- 7 Herschel Mize Dr
- 104 Fincher St
- 57 Mill St
- 5677 Fosters Mill Rd SW
- 10 Ridge Rd SW
- 5598 Fosters Mill Rd
- 0 Mill Rd Unit 10629874
- 0 Mill Rd Unit 7670319
- 8876 Cave Spring Rd SW
- 8876 Cave Spring
- 0 Melson Rd SW Unit 7676052
- 0 Melson Rd SW Unit 10636997
- 907 Gadsden Rd SW
- 123 Santa Claus Rd
- 424 Michael Blvd
- 383 Valley Grove Rd
- 100 Lee Ave
- 0 McGee Bend Rd SW Unit 10351960