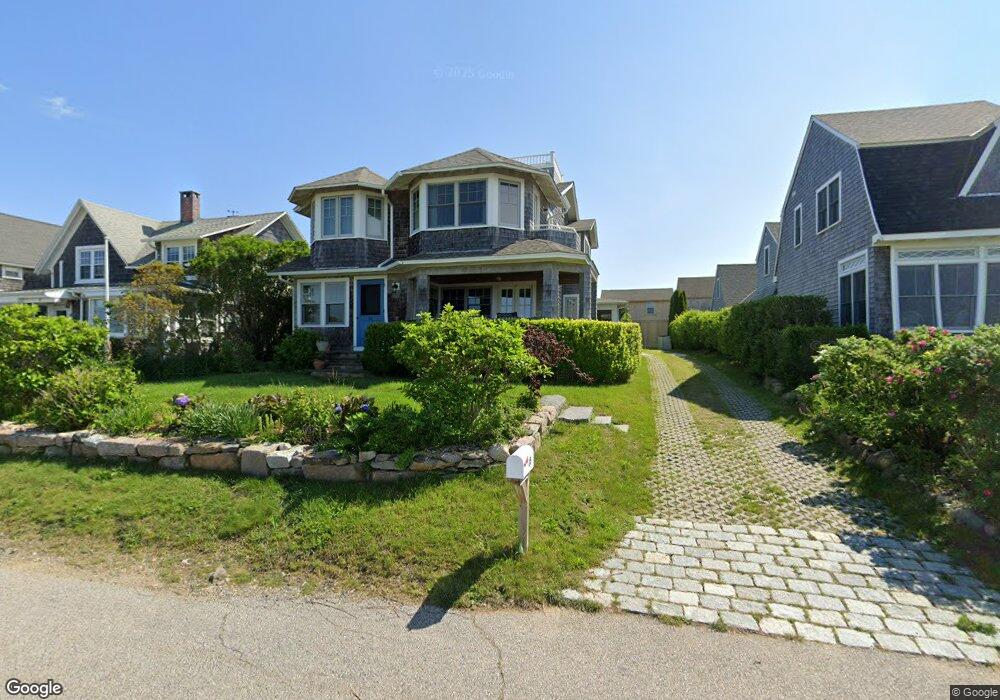
15 Fenway Rd Westerly, RI 02891
Estimated Value: $4,458,000 - $5,203,364
8
Beds
3
Baths
2,416
Sq Ft
$1,975/Sq Ft
Est. Value
About This Home
This home is located at 15 Fenway Rd, Westerly, RI 02891 and is currently estimated at $4,772,091, approximately $1,975 per square foot. 15 Fenway Rd is a home located in Washington County with nearby schools including Westerly High School.
Ownership History
Date
Name
Owned For
Owner Type
Purchase Details
Closed on
Sep 5, 2007
Sold by
Firefly Cottage T
Bought by
Briggs Gretchen G
Current Estimated Value
Purchase Details
Closed on
Sep 24, 1998
Sold by
Coy Arthur H
Bought by
Coy Christopher E and Coy Darlene M S
Home Financials for this Owner
Home Financials are based on the most recent Mortgage that was taken out on this home.
Original Mortgage
$100,000
Interest Rate
6.87%
Mortgage Type
Purchase Money Mortgage
Create a Home Valuation Report for This Property
The Home Valuation Report is an in-depth analysis detailing your home's value as well as a comparison with similar homes in the area
Home Values in the Area
Average Home Value in this Area
Purchase History
| Date | Buyer | Sale Price | Title Company |
|---|---|---|---|
| Briggs Gretchen G | $2,500,000 | -- | |
| Coy Christopher E | $525,000 | -- |
Source: Public Records
Mortgage History
| Date | Status | Borrower | Loan Amount |
|---|---|---|---|
| Previous Owner | Coy Christopher E | $100,000 |
Source: Public Records
Map
Nearby Homes
- 7 Fenway Rd
- 112 Noyes Neck Rd
- 15 Breach Dr
- 22 Breach Dr
- 32 Breach Dr
- 597 Atlantic Ave
- 20 Snowberry Ln
- 11 Bucks Trail
- 46 Salt Pond Way
- 30 Clifford Dr
- 446 Atlantic Ave
- 408 Atlantic Ave
- 342 Post Rd
- 13 Plateau Rd
- 37 Urso Dr
- 5 Robin Hollow Ln
- 44 Rock Ridge Rd
- 19 Wicklow Rd
- 137 Cove Point Rd E
- 54 Sherwood Dr
- 17 Fenway Rd
- 13 Fenway Rd
- 11 Fenway Rd
- 19 Passpataug Ave
- 23 Passpataug Ave
- 25 Passpataug Ave
- 23 Fenway Rd
- 8 Winona Ave
- 17 Passpataug Ave
- 25 Fenway Rd
- 20 Passpataug Ave
- 3 Fenway Rd
- 13 Passpataug Ave
- 20 Knowles Ave
- 32 Wawaloam Dr
- 34 Wawaloam Dr
- 25 Wawaloam Dr
- 5 Waxcadowa Ave
- 26 Knowles Ave
- 36 Wawaloam Dr
Your Personal Tour Guide
Ask me questions while you tour the home.