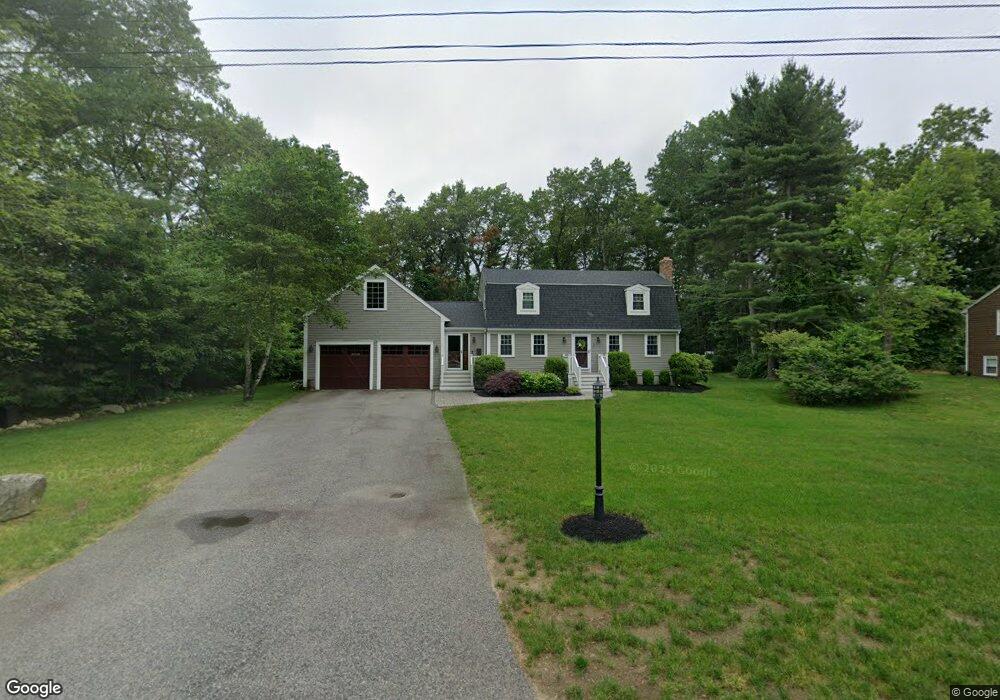
15 Fern Dr Walpole, MA 02081
Estimated Value: $850,000 - $962,000
3
Beds
2
Baths
2,224
Sq Ft
$405/Sq Ft
Est. Value
About This Home
This home is located at 15 Fern Dr, Walpole, MA 02081 and is currently estimated at $901,566, approximately $405 per square foot. 15 Fern Dr is a home located in Norfolk County with nearby schools including Fisher School, Walpole Middle School, and Walpole High School.
Ownership History
Date
Name
Owned For
Owner Type
Purchase Details
Closed on
Jun 29, 2017
Sold by
Frost 3Rd Donald J and Frost Dina L
Bought by
Perachi Edward and Markos Alaina S
Current Estimated Value
Home Financials for this Owner
Home Financials are based on the most recent Mortgage that was taken out on this home.
Original Mortgage
$446,400
Outstanding Balance
$365,565
Interest Rate
3.38%
Mortgage Type
New Conventional
Estimated Equity
$536,001
Purchase Details
Closed on
Sep 15, 1999
Sold by
Levy Allan C
Bought by
Frost Donald J and Frost Dina L
Home Financials for this Owner
Home Financials are based on the most recent Mortgage that was taken out on this home.
Original Mortgage
$194,925
Interest Rate
7.83%
Mortgage Type
Purchase Money Mortgage
Purchase Details
Closed on
Jan 22, 1997
Sold by
Alperin Tr Steven A
Bought by
Levy Allan C
Create a Home Valuation Report for This Property
The Home Valuation Report is an in-depth analysis detailing your home's value as well as a comparison with similar homes in the area
Home Values in the Area
Average Home Value in this Area
Purchase History
| Date | Buyer | Sale Price | Title Company |
|---|---|---|---|
| Perachi Edward | $558,000 | -- | |
| Frost Donald J | $259,900 | -- | |
| Levy Allan C | $79,530 | -- |
Source: Public Records
Mortgage History
| Date | Status | Borrower | Loan Amount |
|---|---|---|---|
| Open | Perachi Edward | $446,400 | |
| Previous Owner | Levy Allan C | $263,000 | |
| Previous Owner | Levy Allan C | $226,000 | |
| Previous Owner | Levy Allan C | $194,925 |
Source: Public Records
Tax History Compared to Growth
Tax History
| Year | Tax Paid | Tax Assessment Tax Assessment Total Assessment is a certain percentage of the fair market value that is determined by local assessors to be the total taxable value of land and additions on the property. | Land | Improvement |
|---|---|---|---|---|
| 2025 | $9,841 | $767,000 | $354,300 | $412,700 |
| 2024 | $9,525 | $720,500 | $340,600 | $379,900 |
| 2023 | $9,062 | $652,400 | $296,200 | $356,200 |
| 2022 | $8,507 | $588,300 | $274,400 | $313,900 |
| 2021 | $8,318 | $560,500 | $258,800 | $301,700 |
| 2020 | $8,009 | $534,300 | $244,100 | $290,200 |
| 2019 | $7,695 | $509,600 | $234,800 | $274,800 |
| 2018 | $7,504 | $491,400 | $226,600 | $264,800 |
| 2017 | $7,289 | $475,500 | $217,900 | $257,600 |
| 2016 | $7,086 | $455,400 | $209,600 | $245,800 |
| 2015 | $6,883 | $438,400 | $199,700 | $238,700 |
| 2014 | $6,578 | $417,400 | $199,700 | $217,700 |
Source: Public Records
Map
Nearby Homes
- 634 Main St Unit 14
- 21 Spear Ave
- 66 Gould St
- 19 and 23 Arlington Ln
- 291 Plimpton St
- 4 Lost Brook Trail
- 4403 Pennington Dr Unit 4403
- 224 School St Unit 10
- 22 Coolidge Rd
- 44 Millbrook Ave
- 103 Centre Ln
- 305 Centre Ln
- 24 Pelican Dr
- 17 Bridle Path
- 8 Rainbow Pond Dr Unit 8
- 2 Alexandra Way
- 12 Timberline Dr Unit 28
- 18 Teal Cir
- 486 Washington St
- 8 Autumn Ln