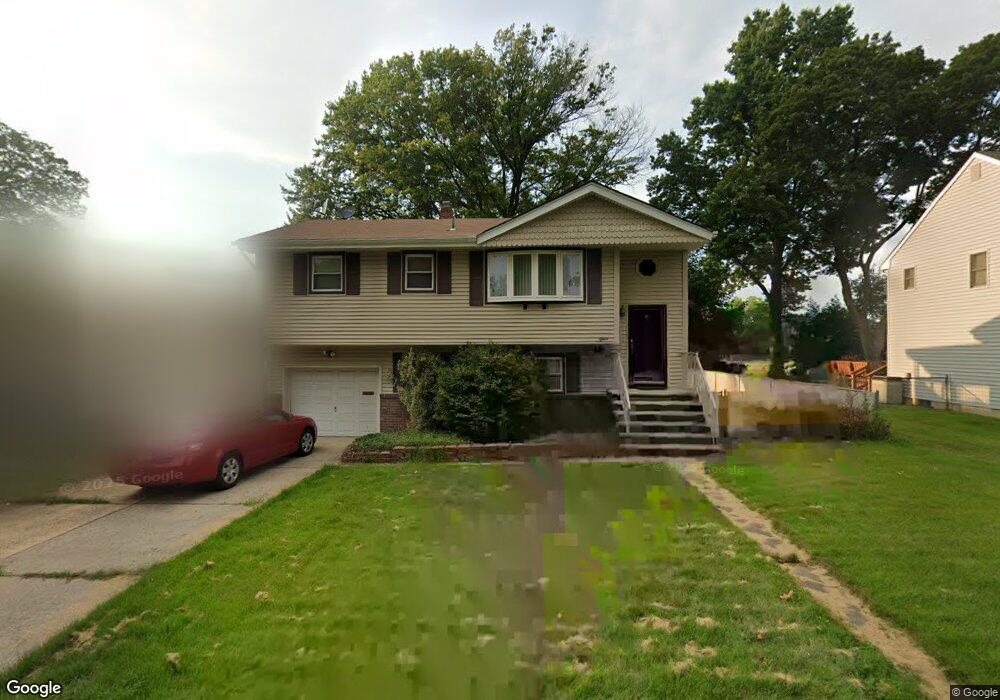
15 Fern St Edison, NJ 08817
Estimated Value: $538,000 - $601,000
3
Beds
2
Baths
952
Sq Ft
$593/Sq Ft
Est. Value
About This Home
This home is located at 15 Fern St, Edison, NJ 08817 and is currently estimated at $564,898, approximately $593 per square foot. 15 Fern St is a home located in Middlesex County with nearby schools including Lindeneau Elementary School, Thomas Jefferson Middle School, and Edison High School.
Ownership History
Date
Name
Owned For
Owner Type
Purchase Details
Closed on
Oct 30, 2008
Sold by
Larry Alice A
Bought by
Dayal Virender and Dayal Rajni
Current Estimated Value
Purchase Details
Closed on
Feb 29, 1996
Sold by
Miraglia Edward
Bought by
James Larry and Larry Alice
Home Financials for this Owner
Home Financials are based on the most recent Mortgage that was taken out on this home.
Original Mortgage
$156,000
Interest Rate
7.02%
Create a Home Valuation Report for This Property
The Home Valuation Report is an in-depth analysis detailing your home's value as well as a comparison with similar homes in the area
Home Values in the Area
Average Home Value in this Area
Purchase History
| Date | Buyer | Sale Price | Title Company |
|---|---|---|---|
| Dayal Virender | $330,000 | Chicago Title Insurance Co | |
| James Larry | $164,000 | -- |
Source: Public Records
Mortgage History
| Date | Status | Borrower | Loan Amount |
|---|---|---|---|
| Previous Owner | James Larry | $156,000 |
Source: Public Records
Tax History Compared to Growth
Tax History
| Year | Tax Paid | Tax Assessment Tax Assessment Total Assessment is a certain percentage of the fair market value that is determined by local assessors to be the total taxable value of land and additions on the property. | Land | Improvement |
|---|---|---|---|---|
| 2025 | $8,043 | $135,100 | $76,000 | $59,100 |
| 2024 | $7,999 | $135,100 | $76,000 | $59,100 |
| 2023 | $7,999 | $135,100 | $76,000 | $59,100 |
| 2022 | $8,002 | $135,100 | $76,000 | $59,100 |
| 2021 | $7,466 | $135,100 | $76,000 | $59,100 |
| 2020 | $7,902 | $135,100 | $76,000 | $59,100 |
| 2019 | $6,948 | $135,100 | $76,000 | $59,100 |
| 2018 | $7,072 | $135,100 | $76,000 | $59,100 |
| 2017 | $6,750 | $135,100 | $76,000 | $59,100 |
| 2016 | $7,128 | $135,100 | $76,000 | $59,100 |
| 2015 | $6,855 | $135,100 | $76,000 | $59,100 |
| 2014 | $6,655 | $135,100 | $76,000 | $59,100 |
Source: Public Records
Map
Nearby Homes