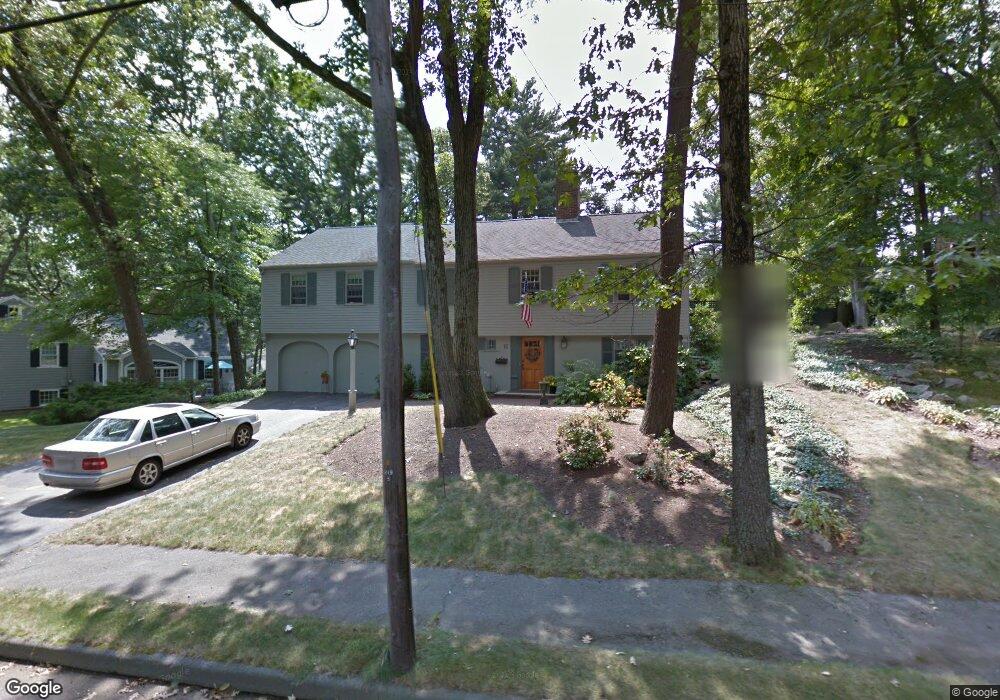
15 Fernway Lynnfield, MA 01940
Estimated Value: $1,042,000 - $1,320,000
4
Beds
3
Baths
2,607
Sq Ft
$437/Sq Ft
Est. Value
About This Home
This home is located at 15 Fernway, Lynnfield, MA 01940 and is currently estimated at $1,138,601, approximately $436 per square foot. 15 Fernway is a home located in Essex County with nearby schools including Lynnfield Middle School, Lynnfield High School, and Odyssey Day School.
Ownership History
Date
Name
Owned For
Owner Type
Purchase Details
Closed on
Apr 23, 2025
Sold by
Basile David and Basile Elizabeth
Bought by
Basile 2025 T and Basile B
Current Estimated Value
Purchase Details
Closed on
Sep 10, 1993
Sold by
Vacaro Albert F and Vacaro Ann C
Bought by
Bisile David and Basilie Elizabeth
Home Financials for this Owner
Home Financials are based on the most recent Mortgage that was taken out on this home.
Original Mortgage
$200,000
Interest Rate
7.21%
Mortgage Type
Purchase Money Mortgage
Create a Home Valuation Report for This Property
The Home Valuation Report is an in-depth analysis detailing your home's value as well as a comparison with similar homes in the area
Home Values in the Area
Average Home Value in this Area
Purchase History
| Date | Buyer | Sale Price | Title Company |
|---|---|---|---|
| Basile 2025 T | -- | None Available | |
| Basile 2025 T | -- | None Available | |
| Basile 2025 T | -- | None Available | |
| Bisile David | $280,000 | -- | |
| Bisile David | $280,000 | -- |
Source: Public Records
Mortgage History
| Date | Status | Borrower | Loan Amount |
|---|---|---|---|
| Previous Owner | Bisile David | $200,000 | |
| Previous Owner | Bisile David | $37,000 | |
| Previous Owner | Bisile David | $200,000 |
Source: Public Records
Tax History Compared to Growth
Tax History
| Year | Tax Paid | Tax Assessment Tax Assessment Total Assessment is a certain percentage of the fair market value that is determined by local assessors to be the total taxable value of land and additions on the property. | Land | Improvement |
|---|---|---|---|---|
| 2025 | $10,385 | $983,400 | $564,200 | $419,200 |
| 2024 | $9,947 | $946,400 | $542,500 | $403,900 |
| 2023 | $9,893 | $875,500 | $514,500 | $361,000 |
| 2022 | $9,347 | $779,600 | $472,500 | $307,100 |
| 2021 | $9,270 | $698,600 | $385,000 | $313,600 |
| 2020 | $8,866 | $636,900 | $344,800 | $292,100 |
| 2019 | $8,859 | $636,900 | $344,800 | $292,100 |
| 2018 | $8,636 | $627,600 | $344,800 | $282,800 |
| 2017 | $8,479 | $615,300 | $332,500 | $282,800 |
| 2016 | $8,243 | $568,500 | $285,300 | $283,200 |
| 2015 | $7,716 | $532,500 | $284,200 | $248,300 |
Source: Public Records
Map
Nearby Homes