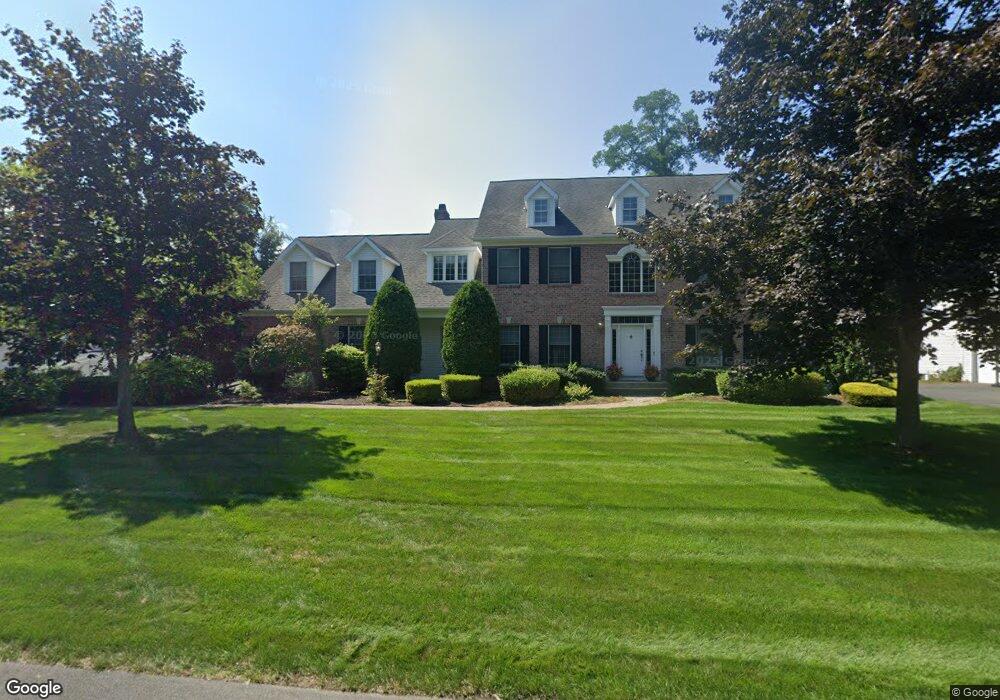
15 Fieldstone Dr Delmar, NY 12054
Estimated Value: $749,000 - $1,121,000
4
Beds
3
Baths
3,758
Sq Ft
$248/Sq Ft
Est. Value
About This Home
This home is located at 15 Fieldstone Dr, Delmar, NY 12054 and is currently estimated at $933,589, approximately $248 per square foot. 15 Fieldstone Dr is a home located in Albany County with nearby schools including St. Thomas the Apostle School and Mt. Moriah Academy.
Ownership History
Date
Name
Owned For
Owner Type
Purchase Details
Closed on
Jun 20, 2008
Sold by
Fitz Paula
Bought by
Sood Vinay
Current Estimated Value
Home Financials for this Owner
Home Financials are based on the most recent Mortgage that was taken out on this home.
Original Mortgage
$417,000
Outstanding Balance
$267,040
Interest Rate
6.01%
Estimated Equity
$666,549
Purchase Details
Closed on
Nov 8, 2001
Sold by
Klersy Building Corp
Bought by
Fitz Paula
Create a Home Valuation Report for This Property
The Home Valuation Report is an in-depth analysis detailing your home's value as well as a comparison with similar homes in the area
Home Values in the Area
Average Home Value in this Area
Purchase History
| Date | Buyer | Sale Price | Title Company |
|---|---|---|---|
| Sood Vinay | $690,000 | George R Slingerland | |
| Sood Vinay | $690,000 | None Available | |
| Fitz Paula | $370,900 | Thomas Latin |
Source: Public Records
Mortgage History
| Date | Status | Borrower | Loan Amount |
|---|---|---|---|
| Open | Sood Vinay | $417,000 | |
| Closed | Sood Vinay | $135,000 |
Source: Public Records
Tax History Compared to Growth
Tax History
| Year | Tax Paid | Tax Assessment Tax Assessment Total Assessment is a certain percentage of the fair market value that is determined by local assessors to be the total taxable value of land and additions on the property. | Land | Improvement |
|---|---|---|---|---|
| 2024 | $21,490 | $653,200 | $71,000 | $582,200 |
| 2023 | $20,920 | $653,200 | $71,000 | $582,200 |
| 2022 | $20,479 | $653,200 | $71,000 | $582,200 |
| 2021 | $20,622 | $653,200 | $71,000 | $582,200 |
| 2020 | $20,507 | $653,200 | $71,000 | $582,200 |
| 2019 | $17,780 | $653,200 | $71,000 | $582,200 |
| 2018 | $20,162 | $653,200 | $71,000 | $582,200 |
| 2017 | $17,446 | $593,000 | $71,000 | $522,000 |
| 2016 | $17,446 | $593,000 | $71,000 | $522,000 |
| 2015 | -- | $530,000 | $71,000 | $459,000 |
| 2014 | -- | $530,000 | $71,000 | $459,000 |
Source: Public Records
Map
Nearby Homes