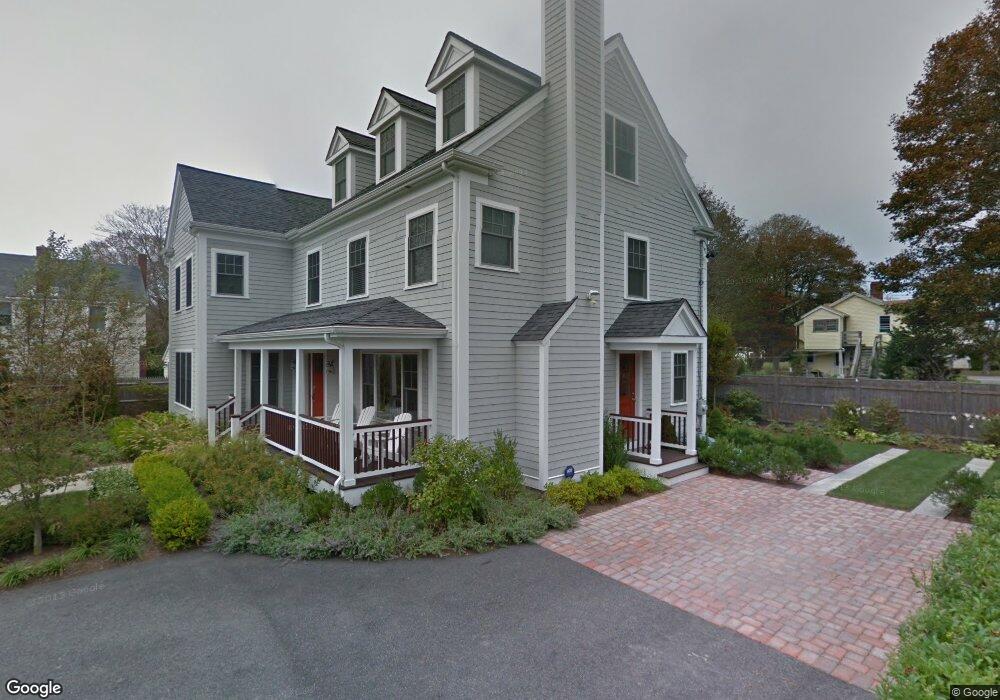
15 Filmore Ct Falmouth, MA 02540
Falmouth Village NeighborhoodEstimated Value: $1,983,000 - $2,229,000
4
Beds
4
Baths
3,380
Sq Ft
$623/Sq Ft
Est. Value
About This Home
This home is located at 15 Filmore Ct, Falmouth, MA 02540 and is currently estimated at $2,104,985, approximately $622 per square foot. 15 Filmore Ct is a home located in Barnstable County with nearby schools including Mullen-Hall School, Lawrence School, and Morse Pond School.
Ownership History
Date
Name
Owned For
Owner Type
Purchase Details
Closed on
Mar 9, 2020
Sold by
Coughlin James B and Coughlin Kerrie A
Bought by
Kerrie Coughlin T and Kerrie Coughlin
Current Estimated Value
Purchase Details
Closed on
Oct 27, 2009
Sold by
Mcdonald David and Mcdonald Jill M
Bought by
Coughlin James B and Coughlin Kerrie A
Purchase Details
Closed on
Nov 2, 1998
Sold by
Threadgold William L
Bought by
Mcdonald David
Purchase Details
Closed on
May 31, 1996
Sold by
Eckstrom Richard C
Bought by
Threadgold William L
Purchase Details
Closed on
Jul 26, 1991
Sold by
Antonucci Robert V and Antonucci Jeanne S
Bought by
Eckstrom Richard C
Create a Home Valuation Report for This Property
The Home Valuation Report is an in-depth analysis detailing your home's value as well as a comparison with similar homes in the area
Home Values in the Area
Average Home Value in this Area
Purchase History
| Date | Buyer | Sale Price | Title Company |
|---|---|---|---|
| Kerrie Coughlin T | -- | None Available | |
| Kerrie Coughlin T | -- | None Available | |
| Coughlin James B | $768,500 | -- | |
| Coughlin James B | $768,500 | -- | |
| Mcdonald David | $140,000 | -- | |
| Mcdonald David | $140,000 | -- | |
| Threadgold William L | $130,000 | -- | |
| Threadgold William L | $130,000 | -- | |
| Eckstrom Richard C | $75,000 | -- | |
| Eckstrom Richard C | $75,000 | -- |
Source: Public Records
Mortgage History
| Date | Status | Borrower | Loan Amount |
|---|---|---|---|
| Previous Owner | Eckstrom Richard C | $293,500 | |
| Previous Owner | Eckstrom Richard C | $361,000 |
Source: Public Records
Tax History Compared to Growth
Tax History
| Year | Tax Paid | Tax Assessment Tax Assessment Total Assessment is a certain percentage of the fair market value that is determined by local assessors to be the total taxable value of land and additions on the property. | Land | Improvement |
|---|---|---|---|---|
| 2025 | $9,258 | $1,577,100 | $462,800 | $1,114,300 |
| 2024 | $8,816 | $1,403,900 | $401,700 | $1,002,200 |
| 2023 | $7,470 | $1,079,500 | $334,800 | $744,700 |
| 2022 | $7,335 | $911,200 | $285,400 | $625,800 |
| 2021 | $6,995 | $822,900 | $285,400 | $537,500 |
| 2020 | $6,846 | $797,000 | $259,500 | $537,500 |
| 2019 | $6,783 | $792,400 | $259,500 | $532,900 |
| 2018 | $6,610 | $768,600 | $259,500 | $509,100 |
| 2017 | $6,376 | $747,500 | $259,500 | $488,000 |
| 2016 | $6,257 | $747,500 | $259,500 | $488,000 |
| 2015 | $6,122 | $747,500 | $259,500 | $488,000 |
| 2014 | $5,732 | $703,300 | $259,500 | $443,800 |
Source: Public Records
Map
Nearby Homes
- 480 Main St Unit 1
- 253 Scranton Ave
- 65 Walker St
- 110 Dillingham Ave Unit 322
- 110 Dillingham Ave Unit 224
- 98 Main St
- 98 Main St Unit 1
- 71 Main St
- 55 Jericho Path
- 30 Katherine Lee Bates Rd
- 9 Fairmount Ave Unit 1
- 9 Fairmount Ave
- 22 Alma Rd
- 33 Oakwood Ave
- 286 Grand Ave Unit 6
- 286 Grand Ave Unit 8
- 286 Grand Ave Unit 4
- 15 Hedge Ln
- 354 Gifford St Unit 5
- 354 Gifford St Unit 2
- 20 Taylor Ct
- 16 Taylor Ct
- 15 Allen Ave
- 25 Allen Ave
- 25 Allen Ave
- 39 Queen St
- 39 Queen St Unit 1-2
- 27 Queen St
- 17 Allen Ave
- 53 Queen St
- 21 Taylor Ct
- 15 Taylor Ct
- 104 King St Unit 2CU
- 21 Queen St
- 104 King St Unit J
- 104 King St Unit I
- 104 King St Unit H
- 104 King St Unit G
- 104 King St Unit F
- 104 King St Unit E