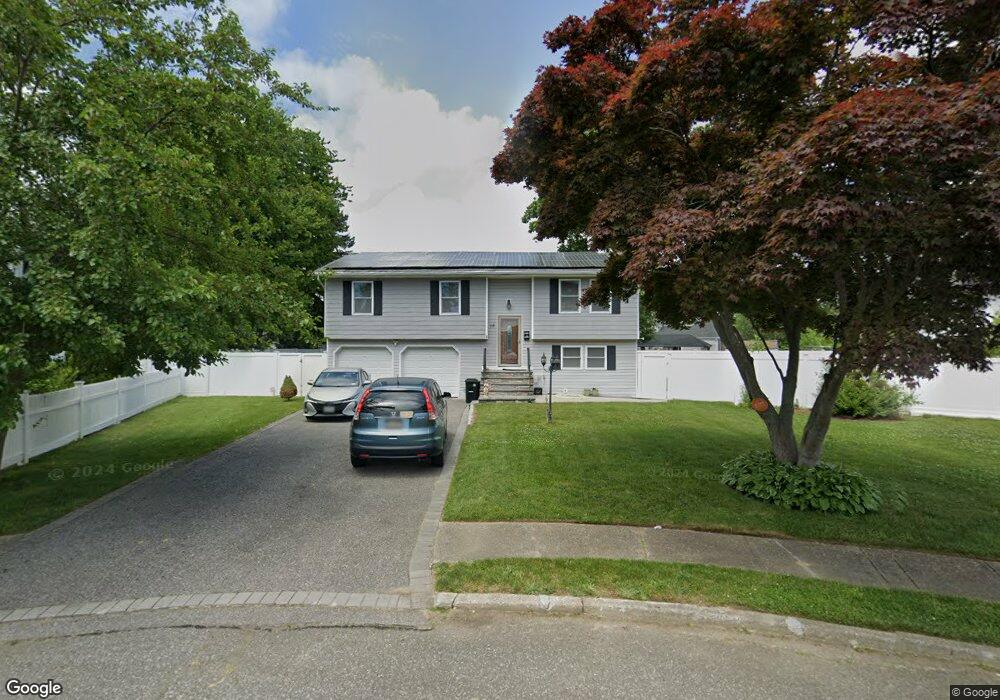
15 Fore Ct Brentwood, NY 11717
Estimated Value: $617,000 - $677,000
4
Beds
2
Baths
1,568
Sq Ft
$413/Sq Ft
Est. Value
About This Home
This home is located at 15 Fore Ct, Brentwood, NY 11717 and is currently estimated at $647,272, approximately $412 per square foot. 15 Fore Ct is a home located in Suffolk County with nearby schools including MDQ Academy.
Ownership History
Date
Name
Owned For
Owner Type
Purchase Details
Closed on
Mar 13, 2015
Sold by
Good Sam Properties Inc
Bought by
George Eapen C and Eapen Ani
Current Estimated Value
Home Financials for this Owner
Home Financials are based on the most recent Mortgage that was taken out on this home.
Original Mortgage
$313,669
Outstanding Balance
$241,035
Interest Rate
3.77%
Mortgage Type
FHA
Estimated Equity
$406,237
Purchase Details
Closed on
Jun 20, 2014
Sold by
Carney Patricia and Mamone Richard
Bought by
Good Sam Properties Inc
Purchase Details
Closed on
Sep 9, 2013
Sold by
Carpentier Angie M
Bought by
County Of Suffolk
Create a Home Valuation Report for This Property
The Home Valuation Report is an in-depth analysis detailing your home's value as well as a comparison with similar homes in the area
Home Values in the Area
Average Home Value in this Area
Purchase History
| Date | Buyer | Sale Price | Title Company |
|---|---|---|---|
| George Eapen C | $324,500 | None Available | |
| Good Sam Properties Inc | $120,000 | -- | |
| County Of Suffolk | -- | -- |
Source: Public Records
Mortgage History
| Date | Status | Borrower | Loan Amount |
|---|---|---|---|
| Open | George Eapen C | $313,669 |
Source: Public Records
Tax History Compared to Growth
Tax History
| Year | Tax Paid | Tax Assessment Tax Assessment Total Assessment is a certain percentage of the fair market value that is determined by local assessors to be the total taxable value of land and additions on the property. | Land | Improvement |
|---|---|---|---|---|
| 2024 | $8,827 | $35,200 | $9,000 | $26,200 |
| 2023 | $8,827 | $35,200 | $9,000 | $26,200 |
| 2022 | $7,915 | $35,200 | $9,000 | $26,200 |
| 2021 | $7,915 | $35,200 | $9,000 | $26,200 |
| 2020 | $8,229 | $35,200 | $9,000 | $26,200 |
| 2019 | $8,229 | $0 | $0 | $0 |
| 2018 | -- | $37,900 | $9,000 | $28,900 |
| 2017 | $8,365 | $37,900 | $9,000 | $28,900 |
| 2016 | $8,267 | $37,900 | $9,000 | $28,900 |
| 2015 | -- | $35,900 | $9,000 | $26,900 |
| 2014 | -- | $35,900 | $9,000 | $26,900 |
Source: Public Records
Map
Nearby Homes