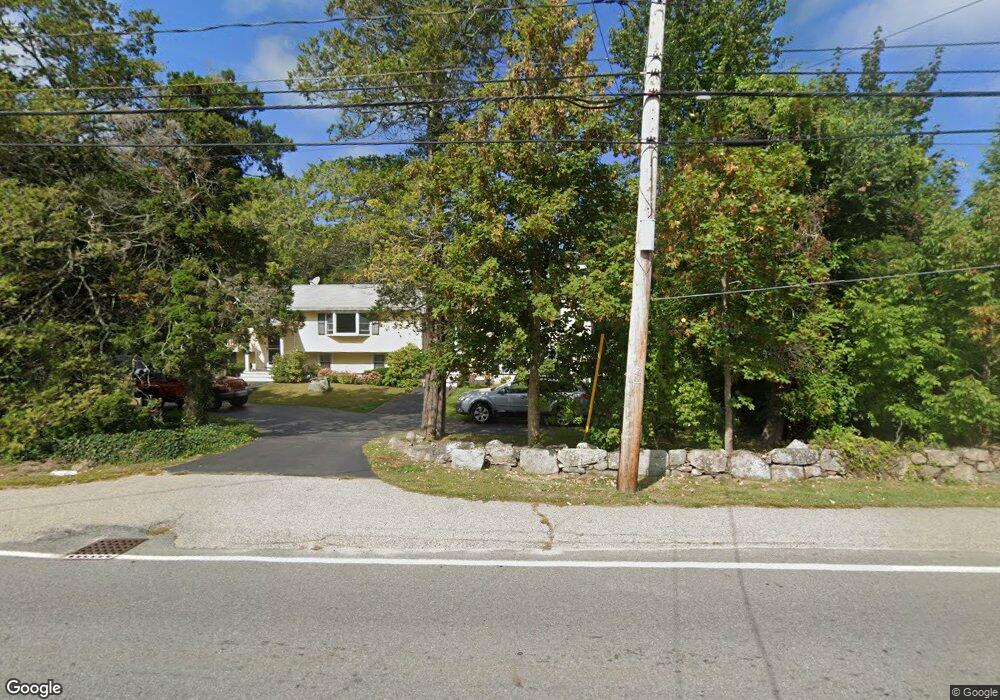
15 Forest Ave Cohasset, MA 02025
Estimated Value: $1,097,000 - $1,197,335
4
Beds
3
Baths
2,504
Sq Ft
$459/Sq Ft
Est. Value
About This Home
This home is located at 15 Forest Ave, Cohasset, MA 02025 and is currently estimated at $1,149,834, approximately $459 per square foot. 15 Forest Ave is a home located in Norfolk County with nearby schools including Joseph Osgood School, Deer Hill School, and Cohasset Middle School.
Ownership History
Date
Name
Owned For
Owner Type
Purchase Details
Closed on
Nov 21, 2023
Sold by
Cook James A and Cook Karen
Bought by
Cook Ft and Cook
Current Estimated Value
Purchase Details
Closed on
Jun 6, 2005
Sold by
Collins Francis C and Collins Margaret M
Bought by
Cook James A and Cook Karen
Create a Home Valuation Report for This Property
The Home Valuation Report is an in-depth analysis detailing your home's value as well as a comparison with similar homes in the area
Home Values in the Area
Average Home Value in this Area
Purchase History
| Date | Buyer | Sale Price | Title Company |
|---|---|---|---|
| Cook Ft | -- | None Available | |
| Cook Ft | -- | None Available | |
| Cook James A | $600,000 | -- | |
| Cook James A | $600,000 | -- |
Source: Public Records
Mortgage History
| Date | Status | Borrower | Loan Amount |
|---|---|---|---|
| Previous Owner | Cook James A | $100,000 | |
| Previous Owner | Cook James A | $250,000 |
Source: Public Records
Tax History Compared to Growth
Tax History
| Year | Tax Paid | Tax Assessment Tax Assessment Total Assessment is a certain percentage of the fair market value that is determined by local assessors to be the total taxable value of land and additions on the property. | Land | Improvement |
|---|---|---|---|---|
| 2025 | $10,356 | $894,300 | $496,100 | $398,200 |
| 2024 | $8,812 | $724,100 | $396,900 | $327,200 |
| 2023 | $8,535 | $723,300 | $396,700 | $326,600 |
| 2022 | $7,449 | $593,100 | $294,100 | $299,000 |
| 2021 | $7,355 | $564,000 | $294,100 | $269,900 |
| 2020 | $7,315 | $564,000 | $294,100 | $269,900 |
| 2019 | $7,276 | $564,000 | $294,100 | $269,900 |
| 2018 | $7,214 | $564,000 | $294,100 | $269,900 |
| 2017 | $7,032 | $538,400 | $280,000 | $258,400 |
| 2016 | $6,935 | $538,400 | $280,000 | $258,400 |
| 2015 | $6,843 | $538,400 | $280,000 | $258,400 |
| 2014 | $6,752 | $538,400 | $280,000 | $258,400 |
Source: Public Records
Map
Nearby Homes
- 29 Heather Dr
- 296 N Main St
- 137 Fairoaks Ln
- 512 N Main St
- 506 N Main St
- 152 Forest Ave
- 31 Chittenden Ln Unit 31
- 247 Forest Ave
- 146 N Main St Unit 146
- 25 Ripley Rd
- 78 Old Pasture Rd
- 119 Pleasant St
- 45 Ocean Ledge Dr
- 15 Cushing Rd
- 89 Ripley Rd
- 114 Hull St
- 166 Hull St
- 10 Ocean Ledge Dr
- 11 Beach St
- 6 Grace Dr