Estimated Value: $821,135 - $857,000
4
Beds
2
Baths
1,756
Sq Ft
$475/Sq Ft
Est. Value
About This Home
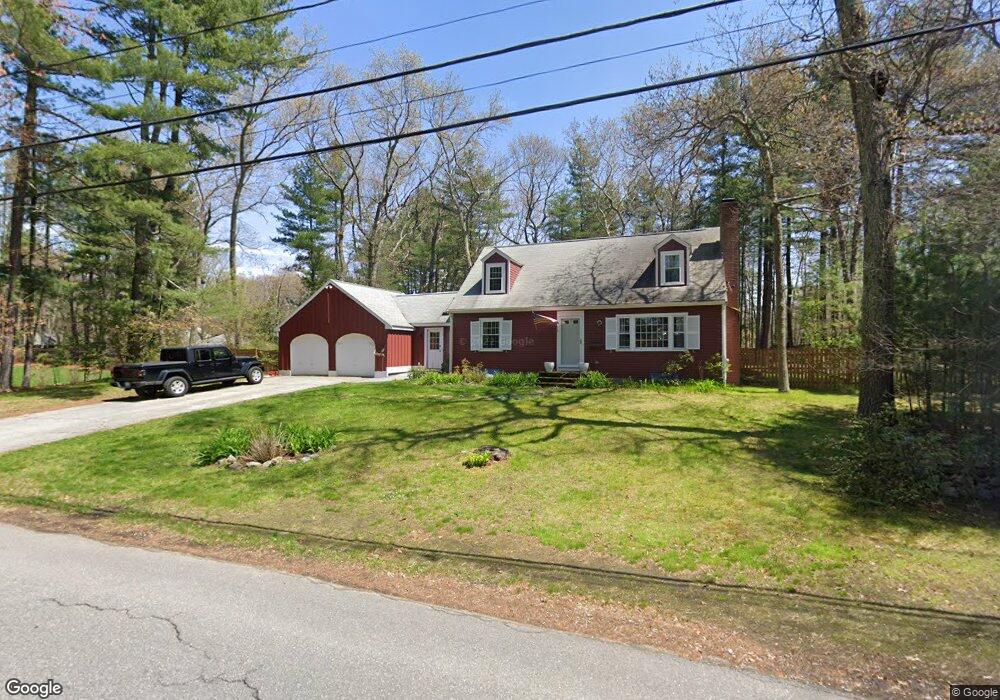
This home is located at 15 Forest Rd, Acton, MA 01720 and is currently estimated at $833,284, approximately $474 per square foot. 15 Forest Rd is a home located in Middlesex County with nearby schools including Acton-Boxborough Regional High School and Nashoba Brooks School.
Ownership History
Date
Name
Owned For
Owner Type
Purchase Details
Closed on
May 15, 2017
Sold by
Madan Sanjay and Madan Anita A
Bought by
Ciampa Jordan and Ciampa Joseph A
Current Estimated Value
Home Financials for this Owner
Home Financials are based on the most recent Mortgage that was taken out on this home.
Original Mortgage
$304,638
Outstanding Balance
$246,662
Interest Rate
4.14%
Mortgage Type
FHA
Estimated Equity
$586,622
Purchase Details
Closed on
Jan 21, 2009
Sold by
Madan-Patton Shireen
Bought by
Madan Anita and Madan Sanjay A
Create a Home Valuation Report for This Property
The Home Valuation Report is an in-depth analysis detailing your home's value as well as a comparison with similar homes in the area
Home Values in the Area
Average Home Value in this Area
Purchase History
| Date | Buyer | Sale Price | Title Company |
|---|---|---|---|
| Ciampa Jordan | $499,000 | -- | |
| Madan Anita | -- | -- | |
| Madan Anita A | -- | -- |
Source: Public Records
Mortgage History
| Date | Status | Borrower | Loan Amount |
|---|---|---|---|
| Open | Ciampa Jordan | $304,638 | |
| Closed | Madan Anita A | $304,638 | |
| Previous Owner | Madan Anita A | $138,000 |
Source: Public Records
Tax History
| Year | Tax Paid | Tax Assessment Tax Assessment Total Assessment is a certain percentage of the fair market value that is determined by local assessors to be the total taxable value of land and additions on the property. | Land | Improvement |
|---|---|---|---|---|
| 2025 | $13,012 | $758,700 | $315,500 | $443,200 |
| 2024 | $12,272 | $736,200 | $315,500 | $420,700 |
| 2023 | $12,422 | $707,400 | $286,700 | $420,700 |
| 2022 | $11,271 | $579,500 | $249,300 | $330,200 |
| 2021 | $10,888 | $538,200 | $230,800 | $307,400 |
| 2020 | $8,631 | $448,600 | $230,800 | $217,800 |
| 2019 | $8,285 | $427,700 | $230,800 | $196,900 |
| 2018 | $8,159 | $421,000 | $230,800 | $190,200 |
| 2017 | $8,024 | $421,000 | $230,800 | $190,200 |
| 2016 | $7,779 | $404,500 | $230,800 | $173,700 |
| 2015 | $7,706 | $404,500 | $230,800 | $173,700 |
| 2014 | $7,564 | $388,900 | $230,800 | $158,100 |
Source: Public Records
Map
Nearby Homes
Your Personal Tour Guide
Ask me questions while you tour the home.