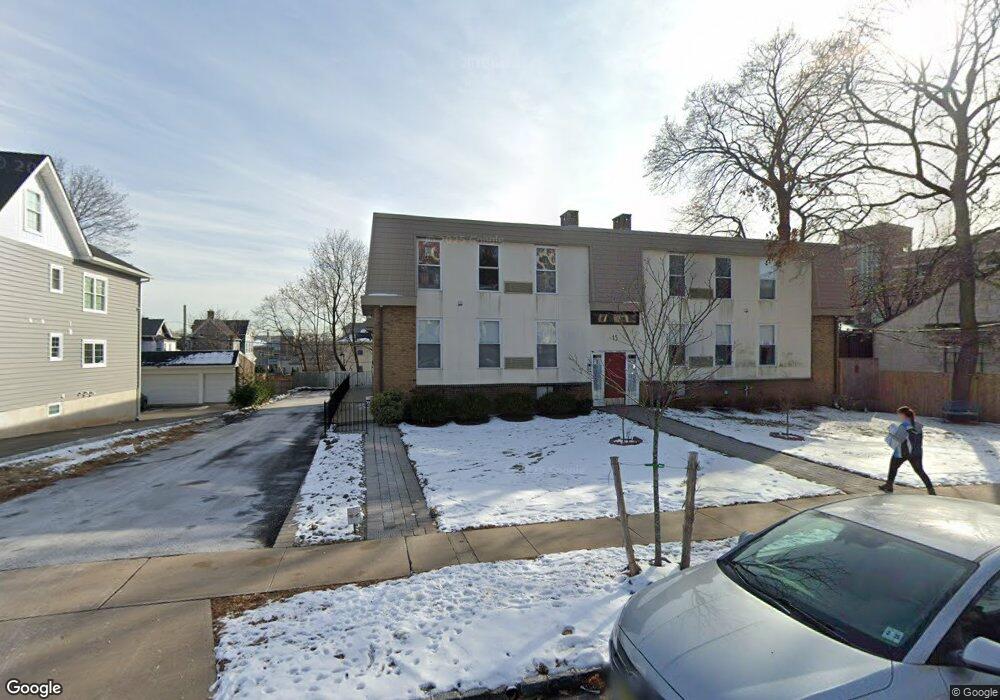
15 Forest St Unit C0011 Montclair, NJ 07042
Estimated Value: $232,013 - $313,000
--
Bed
--
Bath
392
Sq Ft
$709/Sq Ft
Est. Value
About This Home
This home is located at 15 Forest St Unit C0011, Montclair, NJ 07042 and is currently estimated at $277,753, approximately $708 per square foot. 15 Forest St Unit C0011 is a home located in Essex County with nearby schools including Hillside School, Nishuane School, and Bradford School.
Ownership History
Date
Name
Owned For
Owner Type
Purchase Details
Closed on
Aug 2, 2021
Sold by
Arencibia Julian B
Bought by
Luz Wynona
Current Estimated Value
Home Financials for this Owner
Home Financials are based on the most recent Mortgage that was taken out on this home.
Original Mortgage
$169,904
Outstanding Balance
$154,495
Interest Rate
2.9%
Mortgage Type
VA
Estimated Equity
$123,258
Purchase Details
Closed on
Jun 1, 2015
Sold by
Fannie Mae
Bought by
Arencibia Julian B
Purchase Details
Closed on
Feb 12, 2015
Sold by
Baker Jessica
Bought by
Federal National Mortgage Assn
Purchase Details
Closed on
Oct 8, 2004
Sold by
Reilly Kristina
Bought by
Baker Jessica
Home Financials for this Owner
Home Financials are based on the most recent Mortgage that was taken out on this home.
Original Mortgage
$120,000
Interest Rate
5.8%
Create a Home Valuation Report for This Property
The Home Valuation Report is an in-depth analysis detailing your home's value as well as a comparison with similar homes in the area
Home Values in the Area
Average Home Value in this Area
Purchase History
| Date | Buyer | Sale Price | Title Company |
|---|---|---|---|
| Luz Wynona | $170,000 | Nu World Title Llc | |
| Arencibia Julian B | $85,000 | -- | |
| Federal National Mortgage Assn | -- | -- | |
| Baker Jessica | $120,000 | -- |
Source: Public Records
Mortgage History
| Date | Status | Borrower | Loan Amount |
|---|---|---|---|
| Open | Luz Wynona | $169,904 | |
| Previous Owner | Baker Jessica | $120,000 |
Source: Public Records
Tax History Compared to Growth
Tax History
| Year | Tax Paid | Tax Assessment Tax Assessment Total Assessment is a certain percentage of the fair market value that is determined by local assessors to be the total taxable value of land and additions on the property. | Land | Improvement |
|---|---|---|---|---|
| 2025 | $3,860 | $114,200 | $76,500 | $37,700 |
| 2024 | $3,860 | $114,200 | $76,500 | $37,700 |
| 2022 | $3,755 | $114,200 | $76,500 | $37,700 |
| 2021 | $3,690 | $114,200 | $76,500 | $37,700 |
| 2020 | $3,630 | $114,200 | $76,500 | $37,700 |
| 2019 | $3,593 | $114,200 | $76,500 | $37,700 |
| 2018 | $3,533 | $114,200 | $76,500 | $37,700 |
| 2017 | $3,868 | $103,600 | $82,500 | $21,100 |
| 2016 | $3,765 | $103,600 | $82,500 | $21,100 |
| 2015 | $3,653 | $103,600 | $82,500 | $21,100 |
| 2014 | $3,531 | $103,600 | $82,500 | $21,100 |
Source: Public Records
Map
Nearby Homes
- 21 Forest St
- 63 Greenwood Ave
- 70 N Willow St
- 76 Grove St Unit 4
- 76 Grove St
- 81 N Fullerton Ave
- 48 S Park St
- 30 The Crescent Unit 3
- 61-63 Claremont Ave
- 61 Claremont Ave Unit 63
- 50 Pine St Unit 214
- 62 Montague Place Unit 64
- 101 Park St
- 92-94 Midland Ave
- 9 Hawthorne Place
- 27 Grant St
- 26 Orange Rd
- 80 Bay St Unit 8
- 6 William St
- 197 N Fullerton Ave
- 15 Forest St Unit 4
- 15 Forest St Unit C0002
- 15 Forest St Unit C0010
- 15 Forest St Unit C0001
- 15 Forest St Unit C0009
- 15 Forest St Unit C0008
- 15 Forest St Unit C0007
- 15 Forest St Unit C0006
- 15 Forest St Unit C0005
- 15 Forest St Unit C0004
- 15 Forest St Unit C0003
- 15 Forest St Unit 11
- 15 Forest St Unit 10
- 15 Forest St Unit 9
- 15 Forest St Unit 2
- 15 Forest St Unit 8
- 15 Forest St Unit c000
- 15 Forest St Unit 1
- 15 Forest St Unit 6
- 19 Forest St