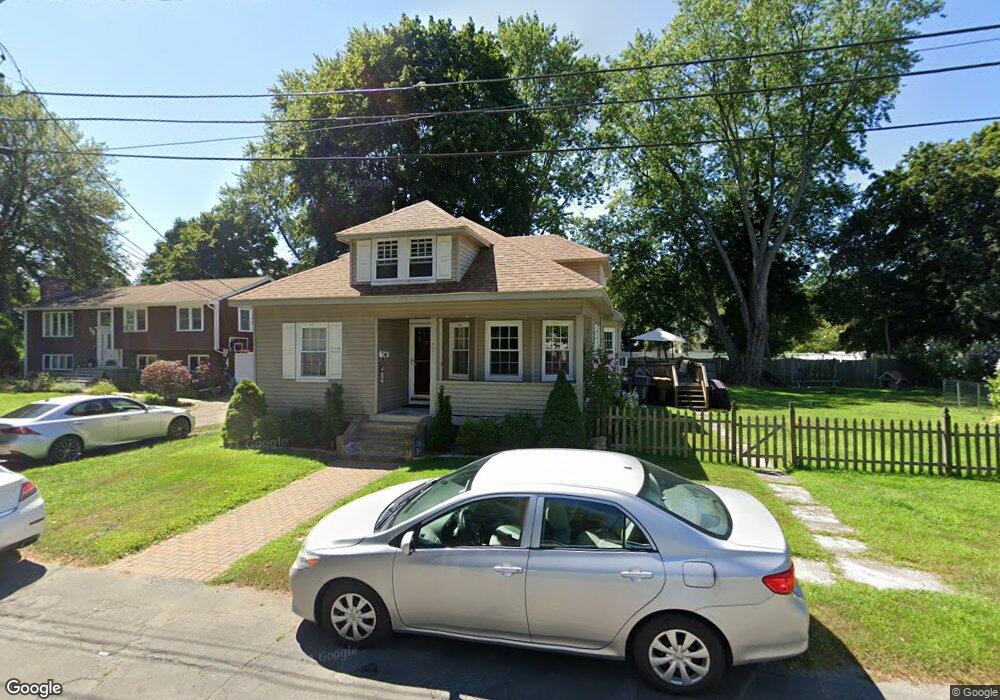
15 Foss Rd Framingham, MA 01702
Estimated Value: $498,000 - $567,000
3
Beds
1
Bath
1,185
Sq Ft
$448/Sq Ft
Est. Value
About This Home
This home is located at 15 Foss Rd, Framingham, MA 01702 and is currently estimated at $530,333, approximately $447 per square foot. 15 Foss Rd is a home located in Middlesex County with nearby schools including Framingham High School, Happy Hollow School, and Pincushion Hill Montessori School.
Ownership History
Date
Name
Owned For
Owner Type
Purchase Details
Closed on
Apr 1, 2025
Sold by
Calvao Dinis R
Bought by
15 Foss Road Llc
Current Estimated Value
Home Financials for this Owner
Home Financials are based on the most recent Mortgage that was taken out on this home.
Original Mortgage
$885,000
Outstanding Balance
$881,236
Interest Rate
6.87%
Mortgage Type
Purchase Money Mortgage
Estimated Equity
-$350,903
Purchase Details
Closed on
Aug 1, 2007
Sold by
Fernandes Ermina and Fernandes Jaime
Bought by
Calvao Dinis R
Purchase Details
Closed on
Apr 22, 1999
Sold by
Blais Rochelle and Trudel Rochelle C
Bought by
Fernandes Ft and Fernandes
Create a Home Valuation Report for This Property
The Home Valuation Report is an in-depth analysis detailing your home's value as well as a comparison with similar homes in the area
Home Values in the Area
Average Home Value in this Area
Purchase History
| Date | Buyer | Sale Price | Title Company |
|---|---|---|---|
| 15 Foss Road Llc | $520,000 | None Available | |
| 15 Foss Road Llc | $520,000 | None Available | |
| Calvao Dinis R | -- | -- | |
| Calvao Dinis R | -- | -- | |
| Fernandes Ft | $162,000 | -- |
Source: Public Records
Mortgage History
| Date | Status | Borrower | Loan Amount |
|---|---|---|---|
| Open | 15 Foss Road Llc | $885,000 | |
| Closed | 15 Foss Road Llc | $885,000 | |
| Previous Owner | Fernandes Ft | $65,000 | |
| Previous Owner | Fernandes Ft | $50,000 |
Source: Public Records
Tax History Compared to Growth
Tax History
| Year | Tax Paid | Tax Assessment Tax Assessment Total Assessment is a certain percentage of the fair market value that is determined by local assessors to be the total taxable value of land and additions on the property. | Land | Improvement |
|---|---|---|---|---|
| 2025 | $5,778 | $483,900 | $203,600 | $280,300 |
| 2024 | $5,357 | $429,900 | $181,100 | $248,800 |
| 2023 | $4,973 | $379,900 | $161,800 | $218,100 |
| 2022 | $4,676 | $340,300 | $146,800 | $193,500 |
| 2021 | $4,555 | $324,200 | $141,000 | $183,200 |
| 2020 | $4,503 | $300,600 | $122,900 | $177,700 |
| 2019 | $4,337 | $282,000 | $117,100 | $164,900 |
| 2018 | $4,220 | $258,600 | $109,000 | $149,600 |
| 2017 | $4,191 | $250,800 | $105,000 | $145,800 |
| 2016 | $3,841 | $221,000 | $99,300 | $121,700 |
| 2015 | $3,917 | $219,800 | $100,300 | $119,500 |
Source: Public Records
Map
Nearby Homes
- 15 Bates Rd
- 36 Bates Rd
- 69 Whitney Ave
- 11 Gilbert St
- 131 Mellen St Unit 3B
- 302 Hollis St Unit R
- 292 Hollis St
- 143 Arlington St
- 181 E Union St
- 25 Eames St
- 26 Wenzell Rd
- 39 Bethany Rd
- 20 Mulhall Dr
- 96 Arlington St
- 77 Arlington St
- 26 Wilde Ave
- 27 Gordon St Unit 206
- 29 Gordon St Unit 104
- 37 James Rd
- 818 Waverly St