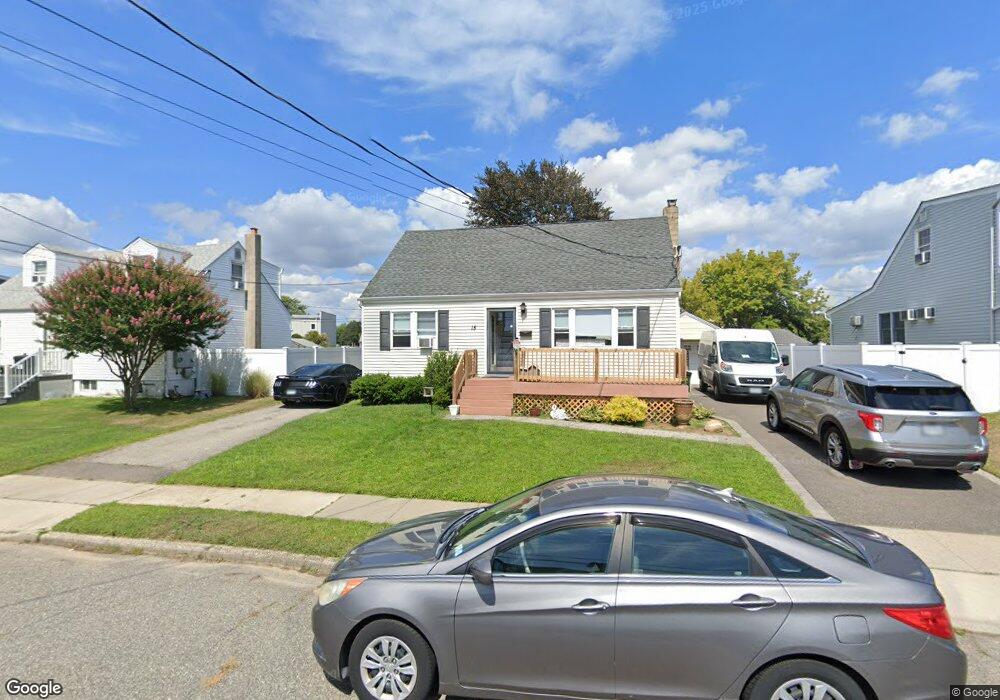
15 Fuller Ave West Babylon, NY 11704
Estimated Value: $548,000 - $604,000
3
Beds
1
Bath
792
Sq Ft
$725/Sq Ft
Est. Value
About This Home
This home is located at 15 Fuller Ave, West Babylon, NY 11704 and is currently estimated at $574,000, approximately $724 per square foot. 15 Fuller Ave is a home located in Suffolk County with nearby schools including West Babylon Senior High School.
Ownership History
Date
Name
Owned For
Owner Type
Purchase Details
Closed on
Oct 16, 2006
Sold by
Litrenta James A
Bought by
Nealon Gerard Jr Jennifer
Current Estimated Value
Purchase Details
Closed on
Dec 22, 2003
Sold by
Ali Seerat
Bought by
Litrenta James A
Home Financials for this Owner
Home Financials are based on the most recent Mortgage that was taken out on this home.
Original Mortgage
$209,000
Interest Rate
5.86%
Mortgage Type
Purchase Money Mortgage
Purchase Details
Closed on
Apr 23, 2002
Sold by
Hud
Bought by
Ali Seerat
Home Financials for this Owner
Home Financials are based on the most recent Mortgage that was taken out on this home.
Original Mortgage
$181,000
Interest Rate
7.13%
Purchase Details
Closed on
Jun 26, 2001
Sold by
Matrix Capital Bank
Bought by
Hud
Purchase Details
Closed on
Jun 5, 1997
Sold by
Connors William and Connors Carol
Bought by
Connors William and Connors Carol
Create a Home Valuation Report for This Property
The Home Valuation Report is an in-depth analysis detailing your home's value as well as a comparison with similar homes in the area
Home Values in the Area
Average Home Value in this Area
Purchase History
| Date | Buyer | Sale Price | Title Company |
|---|---|---|---|
| Nealon Gerard Jr Jennifer | $396,000 | Michael A Mehm | |
| Litrenta James A | $220,000 | Boundary Title Services | |
| Ali Seerat | $190,761 | Lawyers Title Insurance Corp | |
| Hud | -- | Chicago Title Insurance Co | |
| Connors William | -- | Stewart Title Insurance Co |
Source: Public Records
Mortgage History
| Date | Status | Borrower | Loan Amount |
|---|---|---|---|
| Previous Owner | Litrenta James A | $209,000 | |
| Previous Owner | Ali Seerat | $181,000 |
Source: Public Records
Tax History Compared to Growth
Tax History
| Year | Tax Paid | Tax Assessment Tax Assessment Total Assessment is a certain percentage of the fair market value that is determined by local assessors to be the total taxable value of land and additions on the property. | Land | Improvement |
|---|---|---|---|---|
| 2024 | $9,234 | $2,460 | $300 | $2,160 |
| 2023 | $9,234 | $2,460 | $300 | $2,160 |
| 2022 | $6,746 | $2,460 | $300 | $2,160 |
| 2021 | $6,746 | $2,460 | $300 | $2,160 |
| 2020 | $8,228 | $2,460 | $300 | $2,160 |
| 2019 | $8,228 | $0 | $0 | $0 |
| 2018 | $6,667 | $2,460 | $300 | $2,160 |
| 2017 | $6,667 | $2,460 | $300 | $2,160 |
| 2016 | $6,664 | $2,460 | $300 | $2,160 |
| 2015 | -- | $2,460 | $300 | $2,160 |
| 2014 | -- | $2,460 | $300 | $2,160 |
Source: Public Records
Map
Nearby Homes
- 104 Golding Ave
- 31 Fuller Ave
- 210 Farber Dr Unit 210
- 200 Farber Dr Unit 200
- 106 Farber Dr
- 86 Farber Dr Unit 86
- 59 Farber Dr Unit 59
- 669 East Dr
- 10 13th Ave
- 166 & 170 Woodrow Pkwy
- 437 Sunrise Hwy
- 151 Forest Ave
- 34 Karen St
- 16 Della Dr
- 256 Justice St
- 87 Ecker Ave
- 47 15th Ave
- 7 Rosella Ct
- 825 Weber Ave
- 35 Forest Ave