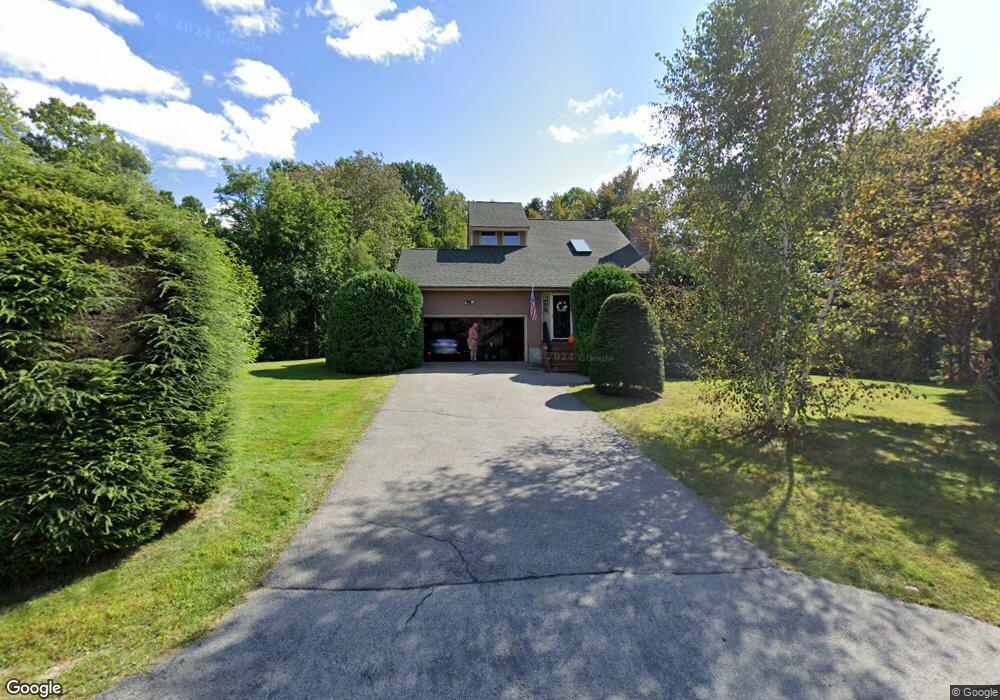
15 Garfield St Methuen, MA 01844
The West End NeighborhoodEstimated Value: $624,000 - $662,000
3
Beds
2
Baths
1,557
Sq Ft
$416/Sq Ft
Est. Value
About This Home
This home is located at 15 Garfield St, Methuen, MA 01844 and is currently estimated at $647,743, approximately $416 per square foot. 15 Garfield St is a home located in Essex County with nearby schools including Marsh Grammar School, South Point Elementary School, and Methuen High School.
Ownership History
Date
Name
Owned For
Owner Type
Purchase Details
Closed on
Aug 22, 1994
Sold by
Lewandowski John
Bought by
Regan John J
Current Estimated Value
Home Financials for this Owner
Home Financials are based on the most recent Mortgage that was taken out on this home.
Original Mortgage
$15,190
Interest Rate
8.61%
Mortgage Type
Purchase Money Mortgage
Create a Home Valuation Report for This Property
The Home Valuation Report is an in-depth analysis detailing your home's value as well as a comparison with similar homes in the area
Home Values in the Area
Average Home Value in this Area
Purchase History
| Date | Buyer | Sale Price | Title Company |
|---|---|---|---|
| Regan John J | $159,900 | -- | |
| Regan John J | $159,900 | -- |
Source: Public Records
Mortgage History
| Date | Status | Borrower | Loan Amount |
|---|---|---|---|
| Open | Regan John J | $135,000 | |
| Closed | Regan John J | $15,190 |
Source: Public Records
Tax History Compared to Growth
Tax History
| Year | Tax Paid | Tax Assessment Tax Assessment Total Assessment is a certain percentage of the fair market value that is determined by local assessors to be the total taxable value of land and additions on the property. | Land | Improvement |
|---|---|---|---|---|
| 2025 | $6,034 | $570,300 | $287,700 | $282,600 |
| 2024 | $6,038 | $556,000 | $261,600 | $294,400 |
| 2023 | $5,687 | $486,100 | $233,600 | $252,500 |
| 2022 | $5,284 | $404,900 | $186,800 | $218,100 |
| 2021 | $4,945 | $374,900 | $177,500 | $197,400 |
| 2020 | $4,946 | $368,000 | $177,500 | $190,500 |
| 2019 | $4,793 | $337,800 | $168,200 | $169,600 |
| 2018 | $4,823 | $338,000 | $168,200 | $169,800 |
| 2017 | $4,657 | $317,900 | $168,200 | $149,700 |
| 2016 | $4,708 | $317,900 | $168,200 | $149,700 |
| 2015 | $4,641 | $317,900 | $168,200 | $149,700 |
Source: Public Records
Map
Nearby Homes
- 96 Harris St
- 1 Bridle Path Ln
- 131 Bridle Path Ln
- 2 Campus Rd
- 128 West St
- 221 Pelham St
- 220 Pelham St
- 73 Myrtle St
- 150 Hampshire Rd
- 1 Tilbury Rd
- 90 Butternut Ln
- 86 Butternut Ln
- 14 Tedesco Rd
- 20 Canobieola Rd
- 0 Carmel Rd Unit 6
- 38 Butternut Ln
- 351 Peters Pond Dr
- 280 & 290 Spring Rd
- 50 & 51 Jane St
- 39 Ticklefancy Ln