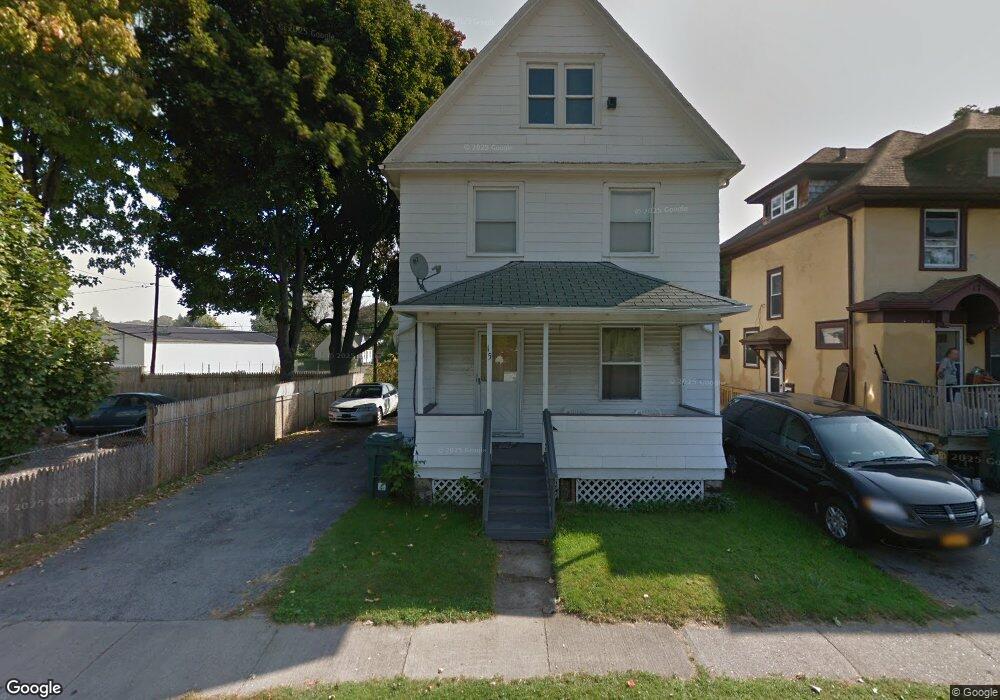
15 Gerling Place Rochester, NY 14611
Dutchtown NeighborhoodEstimated Value: $63,711 - $88,000
4
Beds
1
Bath
1,372
Sq Ft
$58/Sq Ft
Est. Value
About This Home
This home is located at 15 Gerling Place, Rochester, NY 14611 and is currently estimated at $78,928, approximately $57 per square foot. 15 Gerling Place is a home located in Monroe County with nearby schools including Enrico Fermi School No. 17, John Williams School No. 5, and Dr. Louis A. Cerulli School No. 34.
Ownership History
Date
Name
Owned For
Owner Type
Purchase Details
Closed on
May 15, 2007
Sold by
Cornerstone Investment Gr Oup Llc
Bought by
Chavez Michael
Current Estimated Value
Purchase Details
Closed on
Mar 22, 2007
Sold by
Hud
Bought by
Cornerstone Investment Gr
Purchase Details
Closed on
Oct 4, 2002
Sold by
Franckowiak Mark
Bought by
Perez Paula
Purchase Details
Closed on
Jun 28, 2001
Sold by
Bankes Michael
Bought by
Franckowiak
Purchase Details
Closed on
May 10, 1999
Purchase Details
Closed on
Oct 29, 1998
Sold by
Citibank
Bought by
Soldi Joe
Purchase Details
Closed on
Apr 15, 1998
Create a Home Valuation Report for This Property
The Home Valuation Report is an in-depth analysis detailing your home's value as well as a comparison with similar homes in the area
Home Values in the Area
Average Home Value in this Area
Purchase History
| Date | Buyer | Sale Price | Title Company |
|---|---|---|---|
| Chavez Michael | $53,900 | -- | |
| Cornerstone Investment Gr | $24,300 | -- | |
| Perez Paula | $45,600 | Lance J Mark | |
| Franckowiak | $5,000 | Kevin Kuhns | |
| -- | -- | -- | |
| Soldi Joe | $15,000 | -- | |
| -- | $48,102 | -- |
Source: Public Records
Tax History Compared to Growth
Tax History
| Year | Tax Paid | Tax Assessment Tax Assessment Total Assessment is a certain percentage of the fair market value that is determined by local assessors to be the total taxable value of land and additions on the property. | Land | Improvement |
|---|---|---|---|---|
| 2024 | $662 | $46,500 | $3,300 | $43,200 |
| 2023 | $611 | $34,000 | $3,000 | $31,000 |
| 2022 | $437 | $34,000 | $3,000 | $31,000 |
| 2021 | $464 | $34,000 | $3,000 | $31,000 |
| 2020 | $415 | $34,000 | $3,000 | $31,000 |
| 2019 | $358 | $26,000 | $3,000 | $23,000 |
| 2018 | $900 | $26,000 | $3,000 | $23,000 |
| 2017 | $0 | $26,000 | $3,000 | $23,000 |
| 2016 | $358 | $26,000 | $3,000 | $23,000 |
| 2015 | $1,121 | $26,200 | $3,000 | $23,200 |
| 2014 | $1,121 | $26,200 | $3,000 | $23,200 |
Source: Public Records
Map
Nearby Homes