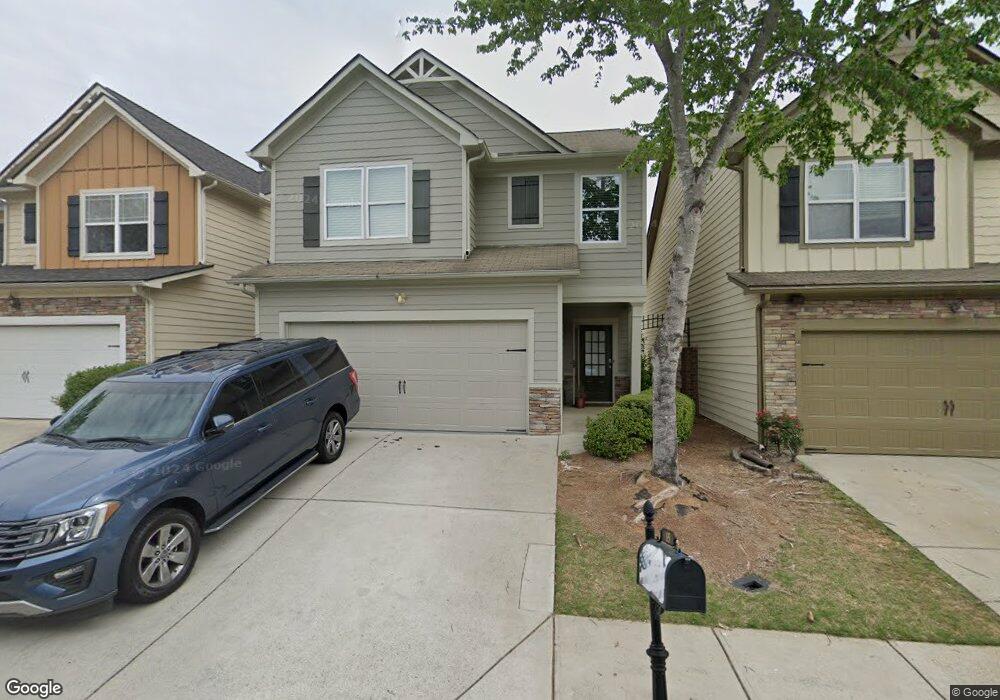
15 Greenfield Dr Unit 13 Dawsonville, GA 30534
Dawson County NeighborhoodEstimated Value: $358,507 - $377,000
3
Beds
3
Baths
1,864
Sq Ft
$196/Sq Ft
Est. Value
About This Home
This home is located at 15 Greenfield Dr Unit 13, Dawsonville, GA 30534 and is currently estimated at $364,877, approximately $195 per square foot. 15 Greenfield Dr Unit 13 is a home located in Dawson County with nearby schools including Kilough Elementary School, Dawson County Middle School, and Dawson County Junior High School.
Ownership History
Date
Name
Owned For
Owner Type
Purchase Details
Closed on
Jun 29, 2023
Sold by
Thirunavu Lakshmi N
Bought by
Captain Lnr Llc
Current Estimated Value
Purchase Details
Closed on
Dec 28, 2017
Sold by
Thomas Joyce H
Bought by
Thirunavu Lakshmi N
Home Financials for this Owner
Home Financials are based on the most recent Mortgage that was taken out on this home.
Original Mortgage
$144,000
Interest Rate
3.9%
Mortgage Type
New Conventional
Purchase Details
Closed on
Jul 20, 2009
Sold by
Highland Pointe Homes
Bought by
Thomas Joyce
Home Financials for this Owner
Home Financials are based on the most recent Mortgage that was taken out on this home.
Original Mortgage
$166,836
Interest Rate
5.37%
Mortgage Type
New Conventional
Purchase Details
Closed on
May 29, 2008
Sold by
Tshp
Bought by
Highland Pointe Homes
Create a Home Valuation Report for This Property
The Home Valuation Report is an in-depth analysis detailing your home's value as well as a comparison with similar homes in the area
Home Values in the Area
Average Home Value in this Area
Purchase History
| Date | Buyer | Sale Price | Title Company |
|---|---|---|---|
| Captain Lnr Llc | -- | None Listed On Document | |
| Thirunavu Lakshmi N | $180,000 | -- | |
| Thomas Joyce | $163,000 | -- | |
| Thomas Joyce | $163,000 | -- | |
| Highland Pointe Homes | $45,000 | -- |
Source: Public Records
Mortgage History
| Date | Status | Borrower | Loan Amount |
|---|---|---|---|
| Previous Owner | Thirunavu Lakshmi N | $144,000 | |
| Previous Owner | Thomas Joyce | $166,836 |
Source: Public Records
Tax History Compared to Growth
Tax History
| Year | Tax Paid | Tax Assessment Tax Assessment Total Assessment is a certain percentage of the fair market value that is determined by local assessors to be the total taxable value of land and additions on the property. | Land | Improvement |
|---|---|---|---|---|
| 2024 | $2,290 | $139,120 | $24,000 | $115,120 |
| 2023 | $2,263 | $150,840 | $24,000 | $126,840 |
| 2022 | $2,575 | $120,200 | $24,000 | $96,200 |
| 2021 | $2,110 | $93,240 | $12,000 | $81,240 |
| 2020 | $2,131 | $90,040 | $12,000 | $78,040 |
| 2019 | $1,919 | $80,400 | $12,000 | $68,400 |
| 2018 | $1,722 | $74,400 | $12,000 | $62,400 |
| 2017 | $1,558 | $65,154 | $12,000 | $53,154 |
| 2016 | $1,524 | $63,714 | $12,000 | $51,714 |
| 2015 | $1,519 | $61,523 | $9,600 | $51,923 |
| 2014 | $1,445 | $56,700 | $9,600 | $47,100 |
| 2013 | -- | $54,284 | $9,600 | $44,684 |
Source: Public Records
Map
Nearby Homes
- 18 Greenfield Dr
- 157 Northfield Cir
- 157 Highland Pointe Cir E
- 208 Highland Pointe Cir E
- 161 Oakmont Dr
- Grenbrier Plan at Castleberry Pointe
- Cambridge Plan at Castleberry Pointe
- Oglethorpe Plan at Castleberry Pointe
- Springdale Plan at Castleberry Pointe
- Addison Plan at Castleberry Pointe
- Brookfield Plan at Castleberry Pointe
- Sweetbriar Plan at Castleberry Pointe
- 0 Whitmire Dr Unit 10454771
- 0 Whitmire Dr Unit 10431935
- 21 Berry Dr
- 102 Berry Dr
- 112 Berry Dr
- 112 Berry Dr Unit 25
- 174 Parkwood Dr
- 152 Parkwood Dr Unit 36
- 15 Greenfield Dr
- 19 Greenfield Dr
- 9 Greenfield Dr
- 31 Greenfield Dr
- 367 Highland Pointe Cir E
- 361 Highland Pointe Cir E
- 358 Highland Pointe Cir E
- 347 Highland Pointe Cir E
- 337 Highland Pointe Cir E
- 39 Greenfield Dr Unit 142
- 39 Greenfield Dr
- 8 Greenfield Dr Unit 147
- 8 Greenfield Dr
- 111 Northfield Cir
- 362 Highland Pointe Cir E Unit 104
- 362 Highland Pointe Cir E
- 30 Greenfield Dr
- 0 Northfield Cir Unit 8660491
- 0 Northfield Cir Unit 8642819
- 0 Northfield Cir Unit 8375172