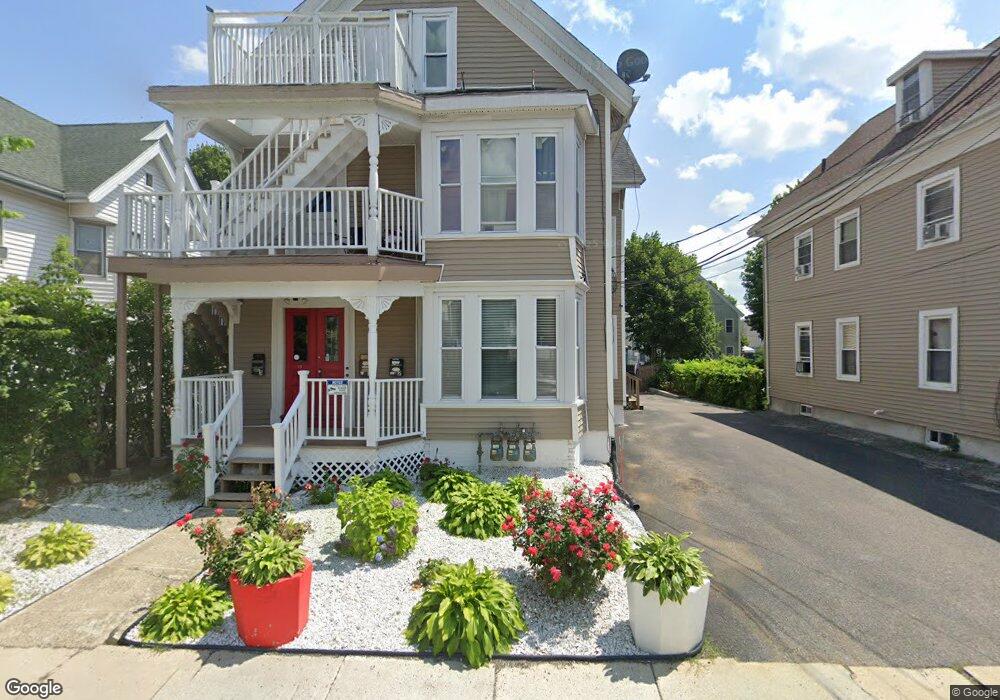
15 Grove St Unit 2 Brockton, MA 02301
Clifton Heights NeighborhoodEstimated Value: $801,000 - $858,263
3
Beds
1
Bath
1,200
Sq Ft
$696/Sq Ft
Est. Value
About This Home
This home is located at 15 Grove St Unit 2, Brockton, MA 02301 and is currently estimated at $834,816, approximately $695 per square foot. 15 Grove St Unit 2 is a home located in Plymouth County with nearby schools including Gilmore Elementary School, Davis K-8 School, and John F. Kennedy Elementary School.
Ownership History
Date
Name
Owned For
Owner Type
Purchase Details
Closed on
Oct 21, 2020
Sold by
Cardona Melvin
Bought by
Dasilveira Julio C and Dasilveira Sandra B
Current Estimated Value
Home Financials for this Owner
Home Financials are based on the most recent Mortgage that was taken out on this home.
Original Mortgage
$574,404
Outstanding Balance
$509,970
Interest Rate
2.8%
Mortgage Type
FHA
Estimated Equity
$324,846
Purchase Details
Closed on
Apr 28, 2003
Sold by
Phua Khang Blong and Phua Khang
Bought by
Khang Chou
Purchase Details
Closed on
Sep 26, 2002
Sold by
Oshea James and Oshea Jeanne
Bought by
Cardona Melvin and Cardona Helen
Create a Home Valuation Report for This Property
The Home Valuation Report is an in-depth analysis detailing your home's value as well as a comparison with similar homes in the area
Home Values in the Area
Average Home Value in this Area
Purchase History
| Date | Buyer | Sale Price | Title Company |
|---|---|---|---|
| Dasilveira Julio C | $585,000 | None Available | |
| Cardona Melvin | -- | None Available | |
| Khang Chou | -- | -- | |
| Cardona Melvin | $264,900 | -- |
Source: Public Records
Mortgage History
| Date | Status | Borrower | Loan Amount |
|---|---|---|---|
| Open | Dasilveira Julio C | $574,404 | |
| Previous Owner | Cardona Melvin | $280,678 | |
| Previous Owner | Cardona Melvin | $281,000 | |
| Previous Owner | Cardona Melvin | $40,000 | |
| Previous Owner | Cardona Melvin | $276,000 |
Source: Public Records
Tax History Compared to Growth
Tax History
| Year | Tax Paid | Tax Assessment Tax Assessment Total Assessment is a certain percentage of the fair market value that is determined by local assessors to be the total taxable value of land and additions on the property. | Land | Improvement |
|---|---|---|---|---|
| 2025 | $7,989 | $659,700 | $137,100 | $522,600 |
| 2024 | $7,817 | $650,300 | $137,100 | $513,200 |
| 2023 | $7,746 | $596,800 | $102,400 | $494,400 |
| 2022 | $7,681 | $549,800 | $92,900 | $456,900 |
| 2021 | $7,054 | $486,500 | $76,900 | $409,600 |
| 2020 | $6,208 | $409,800 | $72,400 | $337,400 |
| 2019 | $5,865 | $377,400 | $70,100 | $307,300 |
| 2018 | $5,986 | $332,600 | $70,100 | $262,500 |
| 2017 | $4,830 | $300,000 | $70,100 | $229,900 |
| 2016 | $4,139 | $238,400 | $68,000 | $170,400 |
| 2015 | $3,514 | $193,600 | $68,000 | $125,600 |
| 2014 | $3,437 | $189,600 | $68,000 | $121,600 |
Source: Public Records
Map
Nearby Homes