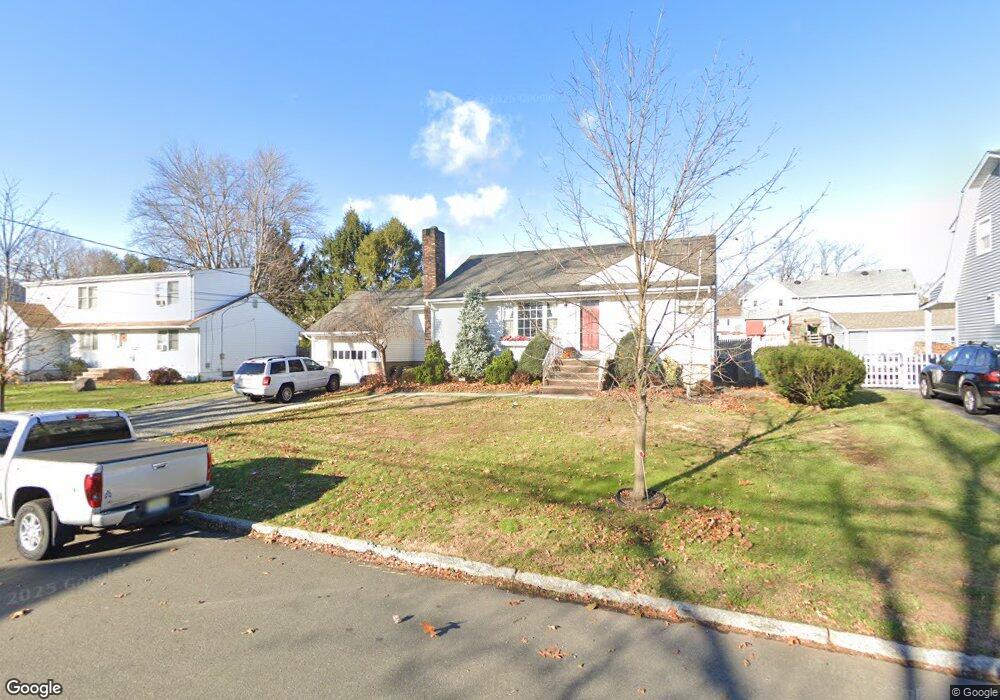
15 Grove St Waldwick, NJ 07463
Estimated Value: $555,000 - $668,000
--
Bed
--
Bath
1,008
Sq Ft
$606/Sq Ft
Est. Value
About This Home
This home is located at 15 Grove St, Waldwick, NJ 07463 and is currently estimated at $610,351, approximately $605 per square foot. 15 Grove St is a home located in Bergen County with nearby schools including Waldwick High School, Waldwick Seventh-Day Adventist School, and The Village School - Montessori.
Ownership History
Date
Name
Owned For
Owner Type
Purchase Details
Closed on
Oct 22, 2007
Sold by
Vecch Elizabeth and Smith William D
Bought by
Smith William D and Smith Jamie
Current Estimated Value
Purchase Details
Closed on
Jul 20, 2000
Sold by
Vecch Elizabeth and Malatesta Elizabeth
Bought by
Vecch Elizabeth and Smith William D
Home Financials for this Owner
Home Financials are based on the most recent Mortgage that was taken out on this home.
Original Mortgage
$100,000
Interest Rate
8.12%
Create a Home Valuation Report for This Property
The Home Valuation Report is an in-depth analysis detailing your home's value as well as a comparison with similar homes in the area
Home Values in the Area
Average Home Value in this Area
Purchase History
| Date | Buyer | Sale Price | Title Company |
|---|---|---|---|
| Smith William D | -- | -- | |
| Vecch Elizabeth | -- | Quest Title Agency Inc | |
| Vecch Elizabeth Ann | $54,000 | -- |
Source: Public Records
Mortgage History
| Date | Status | Borrower | Loan Amount |
|---|---|---|---|
| Previous Owner | Vecch Elizabeth Ann | $100,000 |
Source: Public Records
Tax History Compared to Growth
Tax History
| Year | Tax Paid | Tax Assessment Tax Assessment Total Assessment is a certain percentage of the fair market value that is determined by local assessors to be the total taxable value of land and additions on the property. | Land | Improvement |
|---|---|---|---|---|
| 2025 | $12,432 | $561,500 | $348,800 | $212,700 |
| 2024 | $11,708 | $561,500 | $348,800 | $212,700 |
| 2023 | $11,466 | $402,600 | $281,300 | $121,300 |
| 2022 | $11,466 | $402,600 | $281,300 | $121,300 |
| 2021 | $11,249 | $402,600 | $281,300 | $121,300 |
| 2020 | $11,140 | $402,600 | $281,300 | $121,300 |
| 2019 | $11,136 | $402,600 | $281,300 | $121,300 |
| 2018 | $10,786 | $402,600 | $281,300 | $121,300 |
| 2017 | $10,693 | $402,600 | $281,300 | $121,300 |
| 2016 | $10,476 | $402,600 | $281,300 | $121,300 |
| 2015 | $10,355 | $402,600 | $281,300 | $121,300 |
| 2014 | $10,105 | $402,600 | $281,300 | $121,300 |
Source: Public Records
Map
Nearby Homes