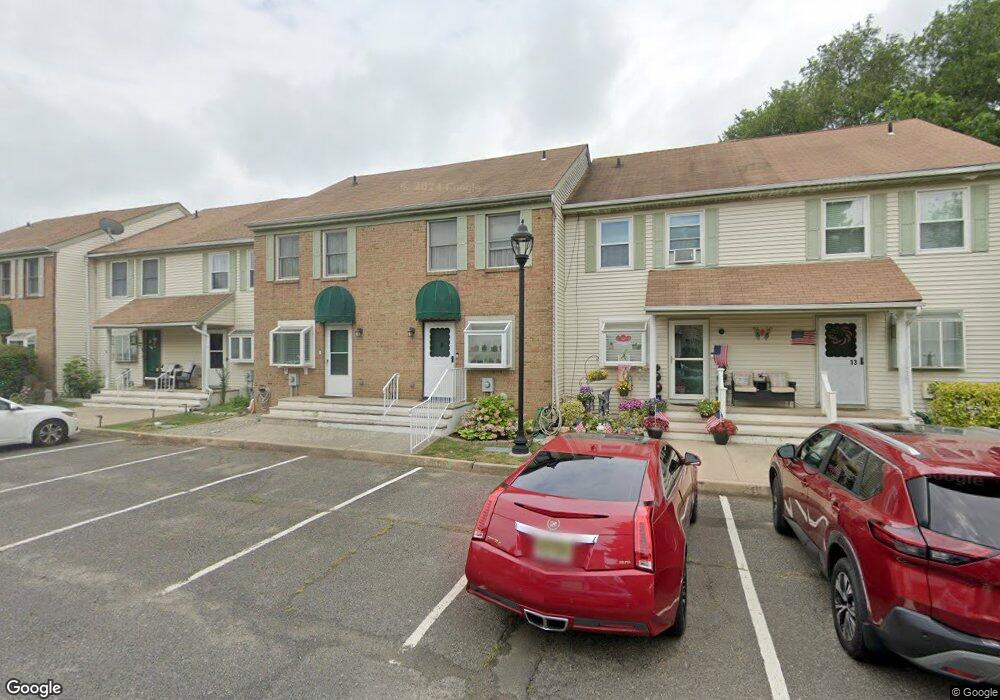
15 Gull Way Keyport, NJ 07735
Estimated Value: $392,916 - $418,000
2
Beds
2
Baths
1,024
Sq Ft
$396/Sq Ft
Est. Value
About This Home
This home is located at 15 Gull Way, Keyport, NJ 07735 and is currently estimated at $405,479, approximately $395 per square foot. 15 Gull Way is a home located in Monmouth County with nearby schools including Keyport Central School, Keyport High School, and Icob Academy.
Ownership History
Date
Name
Owned For
Owner Type
Purchase Details
Closed on
Aug 8, 2020
Sold by
Burns Mary T and Estate Of Mary Margaret Hand
Bought by
Trahim Terence James
Current Estimated Value
Home Financials for this Owner
Home Financials are based on the most recent Mortgage that was taken out on this home.
Original Mortgage
$188,000
Outstanding Balance
$166,769
Interest Rate
3%
Mortgage Type
New Conventional
Estimated Equity
$238,710
Purchase Details
Closed on
Aug 5, 1999
Sold by
Thomas Darcie
Bought by
Hand Mary
Create a Home Valuation Report for This Property
The Home Valuation Report is an in-depth analysis detailing your home's value as well as a comparison with similar homes in the area
Home Values in the Area
Average Home Value in this Area
Purchase History
| Date | Buyer | Sale Price | Title Company |
|---|---|---|---|
| Trahim Terence James | $235,000 | Foundation Title Llc | |
| Hand Mary | $108,000 | -- |
Source: Public Records
Mortgage History
| Date | Status | Borrower | Loan Amount |
|---|---|---|---|
| Open | Trahim Terence James | $188,000 |
Source: Public Records
Tax History Compared to Growth
Tax History
| Year | Tax Paid | Tax Assessment Tax Assessment Total Assessment is a certain percentage of the fair market value that is determined by local assessors to be the total taxable value of land and additions on the property. | Land | Improvement |
|---|---|---|---|---|
| 2025 | $6,417 | $350,000 | $180,000 | $170,000 |
| 2024 | $6,319 | $310,000 | $148,400 | $161,600 |
| 2023 | $6,319 | $287,500 | $134,900 | $152,600 |
| 2022 | $5,899 | $261,800 | $117,300 | $144,500 |
| 2021 | $5,899 | $233,700 | $104,700 | $129,000 |
| 2020 | $5,658 | $222,500 | $99,800 | $122,700 |
| 2019 | $5,454 | $214,800 | $95,000 | $119,800 |
| 2018 | $5,125 | $197,100 | $85,000 | $112,100 |
| 2017 | $5,102 | $195,700 | $85,000 | $110,700 |
| 2016 | $4,899 | $189,500 | $85,000 | $104,500 |
| 2015 | $4,885 | $188,100 | $85,000 | $103,100 |
| 2014 | $5,198 | $202,100 | $90,000 | $112,100 |
Source: Public Records
Map
Nearby Homes
- 69 Maple Place
- 8 Chingarora Ave
- 9 Monmouth Place
- 95 Broadway
- 127 Chingarora Ave
- 226 Osborn St
- 253 Broadway
- 194 Washington St
- 116 Therese Ave
- 40 Church St
- 55 E Front St
- 90 Saint Peters Place
- 1 Hobart St
- 195 Atlantic St
- 52 Highway 35
- 231 Atlantic St Unit 23
- 324 Maple Place
- 25-27 Brook Ave
- 279 Washington St
- 128 1st St