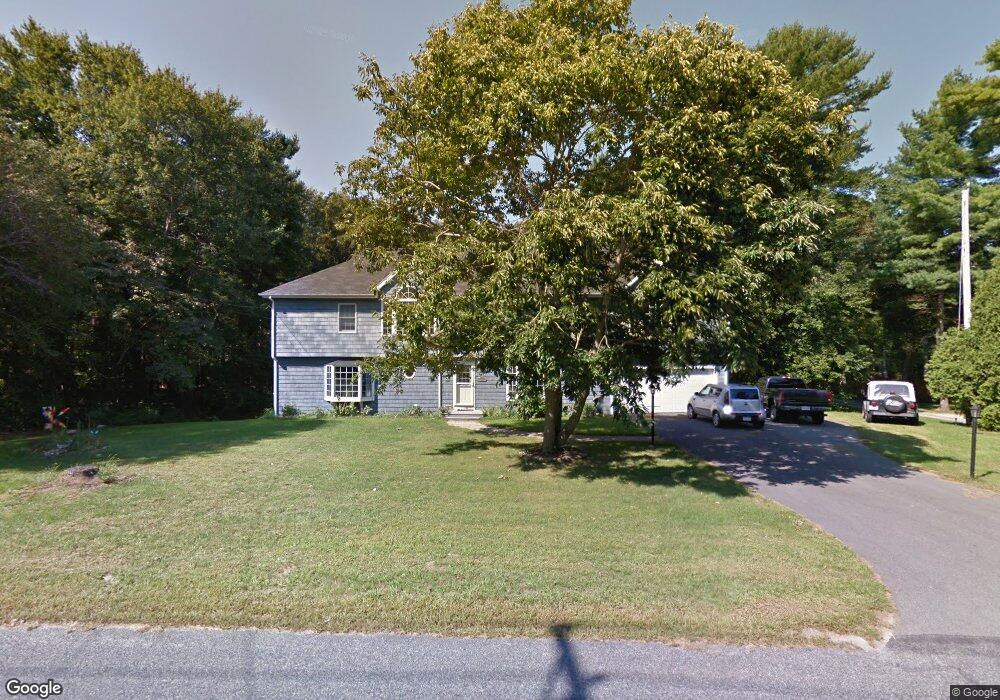
15 Gurney Rd East Freetown, MA 02717
Estimated Value: $700,046
4
Beds
3
Baths
3,138
Sq Ft
$223/Sq Ft
Est. Value
About This Home
This home is located at 15 Gurney Rd, East Freetown, MA 02717 and is currently priced at $700,046, approximately $223 per square foot. 15 Gurney Rd is a home located in Bristol County with nearby schools including Freetown Elementary School, George R Austin Intermediate School, and Freetown-Lakeville Middle School.
Ownership History
Date
Name
Owned For
Owner Type
Purchase Details
Closed on
Jan 19, 2018
Sold by
Gurney Miriam
Bought by
Stockwell Wendy E
Current Estimated Value
Purchase Details
Closed on
Mar 14, 2013
Sold by
Gurney Judith A and Stockwell Wendy E
Bought by
Stockwell Wendy E
Purchase Details
Closed on
Dec 1, 1983
Bought by
Stockwell Wendy E
Create a Home Valuation Report for This Property
The Home Valuation Report is an in-depth analysis detailing your home's value as well as a comparison with similar homes in the area
Home Values in the Area
Average Home Value in this Area
Purchase History
| Date | Buyer | Sale Price | Title Company |
|---|---|---|---|
| Stockwell Wendy E | -- | -- | |
| Stockwell Wendy E | -- | -- | |
| Stockwell Wendy E | $10,000 | -- |
Source: Public Records
Mortgage History
| Date | Status | Borrower | Loan Amount |
|---|---|---|---|
| Previous Owner | Stockwell Wendy E | $140,000 |
Source: Public Records
Tax History Compared to Growth
Tax History
| Year | Tax Paid | Tax Assessment Tax Assessment Total Assessment is a certain percentage of the fair market value that is determined by local assessors to be the total taxable value of land and additions on the property. | Land | Improvement |
|---|---|---|---|---|
| 2025 | $0 | $697,700 | $177,000 | $520,700 |
| 2024 | $6,787 | $665,000 | $167,000 | $498,000 |
| 2023 | $6,787 | $633,700 | $150,400 | $483,300 |
| 2022 | $6,541 | $542,400 | $127,400 | $415,000 |
| 2021 | $6,350 | $500,000 | $115,800 | $384,200 |
| 2020 | $6,412 | $492,500 | $111,400 | $381,100 |
| 2019 | $6,107 | $464,400 | $106,100 | $358,300 |
| 2018 | $5,755 | $432,400 | $106,100 | $326,300 |
| 2017 | $5,566 | $417,900 | $106,100 | $311,800 |
| 2016 | $5,356 | $409,200 | $103,000 | $306,200 |
| 2015 | $5,252 | $407,100 | $103,000 | $304,100 |
| 2014 | $4,961 | $393,400 | $100,900 | $292,500 |
Source: Public Records
Map
Nearby Homes
- 11 Gurney Rd
- 23 Parker Dr
- 0 Costa Dr
- 8 Denise Ave
- 144 Chace Rd
- 24 Bells Brook Rd
- 19 Hilltop Acres Dr
- 4597 Acushnet Ave
- 3 Elaine Ave
- 36 Winfield St
- 1599 Braley Rd Unit 68
- Lot 2 Sherwood Ln
- Lot 1 Sherwood Ln
- 1573 Braley Rd Unit 39
- 15 Morrison Way
- 2 Hayes St
- 120 Hackett Ave
- 1 Elaine Cir
- 595 Quanapoag Rd
- 599 Quanapoag Rd