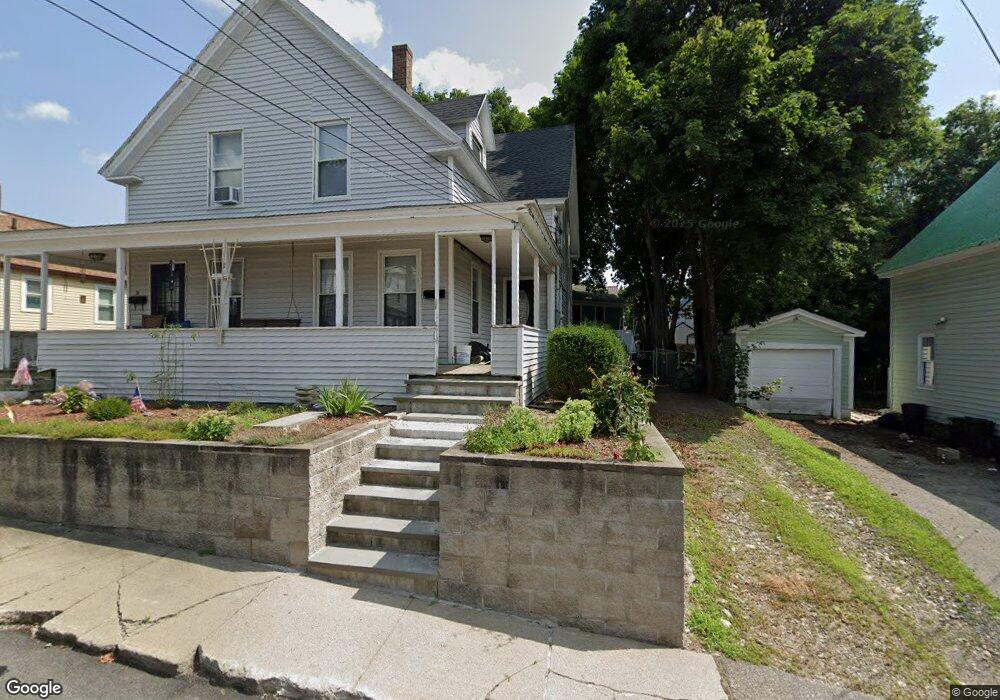
15 Hammond St Unit 17 Sanford, ME 04073
Estimated Value: $314,857 - $385,000
5
Beds
2
Baths
2,100
Sq Ft
$169/Sq Ft
Est. Value
About This Home
This home is located at 15 Hammond St Unit 17, Sanford, ME 04073 and is currently estimated at $355,214, approximately $169 per square foot. 15 Hammond St Unit 17 is a home located in York County with nearby schools including Sanford Christian Academy and St Thomas Consolidated School.
Ownership History
Date
Name
Owned For
Owner Type
Purchase Details
Closed on
Jun 10, 2013
Sold by
Fss T T and Fss Robichaud
Bought by
Foster Shirley A
Current Estimated Value
Home Financials for this Owner
Home Financials are based on the most recent Mortgage that was taken out on this home.
Original Mortgage
$94,500
Outstanding Balance
$66,583
Interest Rate
3.43%
Mortgage Type
Purchase Money Mortgage
Estimated Equity
$288,631
Purchase Details
Closed on
Jul 28, 2008
Sold by
Robichaud Shirley A
Bought by
Fss T T and Fss Robichaud
Create a Home Valuation Report for This Property
The Home Valuation Report is an in-depth analysis detailing your home's value as well as a comparison with similar homes in the area
Home Values in the Area
Average Home Value in this Area
Purchase History
| Date | Buyer | Sale Price | Title Company |
|---|---|---|---|
| Foster Shirley A | -- | -- | |
| Foster Shirley A | -- | -- | |
| Fss T T | -- | -- |
Source: Public Records
Mortgage History
| Date | Status | Borrower | Loan Amount |
|---|---|---|---|
| Open | Foster Shirley A | $94,500 | |
| Closed | Fss T T | $94,500 | |
| Previous Owner | Fss T T | $25,000 |
Source: Public Records
Tax History Compared to Growth
Tax History
| Year | Tax Paid | Tax Assessment Tax Assessment Total Assessment is a certain percentage of the fair market value that is determined by local assessors to be the total taxable value of land and additions on the property. | Land | Improvement |
|---|---|---|---|---|
| 2025 | $3,959 | $231,500 | $28,300 | $203,200 |
| 2024 | $3,736 | $231,500 | $28,300 | $203,200 |
| 2023 | $3,473 | $229,400 | $28,300 | $201,100 |
| 2022 | $3,395 | $229,400 | $28,300 | $201,100 |
| 2021 | $2,972 | $163,500 | $28,300 | $135,200 |
| 2020 | $2,939 | $145,800 | $28,300 | $117,500 |
| 2019 | $2,850 | $137,700 | $28,300 | $109,400 |
| 2018 | $2,094 | $137,700 | $28,300 | $109,400 |
| 2017 | $2,856 | $137,700 | $28,300 | $109,400 |
| 2016 | $2,356 | $103,600 | $28,300 | $75,300 |
| 2015 | $2,094 | $105,000 | $28,300 | $76,700 |
| 2014 | $2,021 | $102,000 | $28,300 | $73,700 |
| 2013 | -- | $103,500 | $28,300 | $75,200 |
Source: Public Records
Map
Nearby Homes