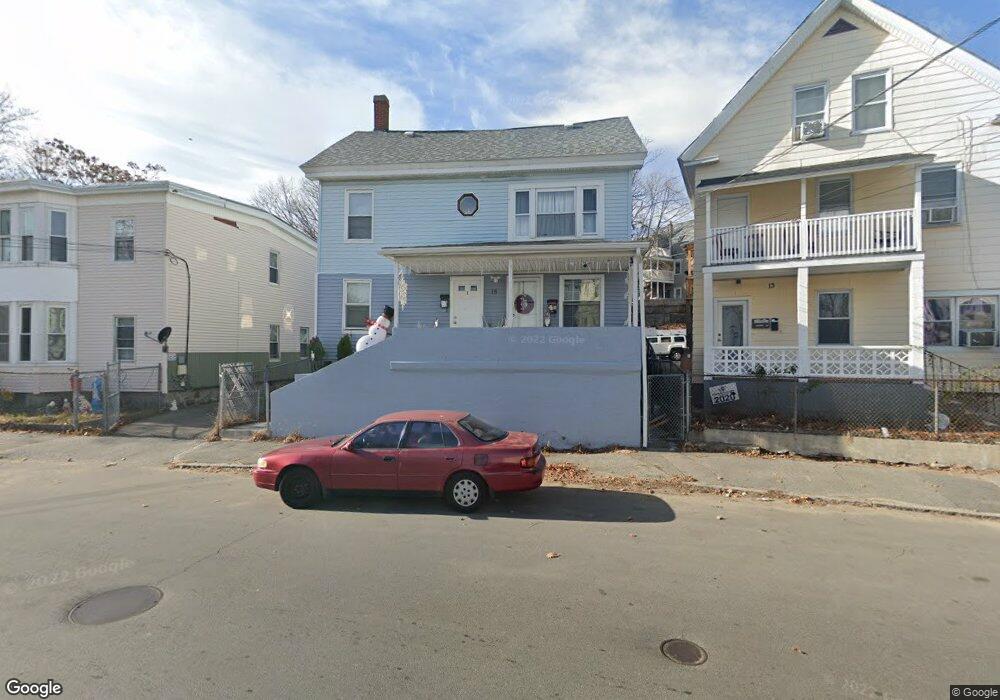
15 Hancock St Lawrence, MA 01841
Tower Hill NeighborhoodEstimated Value: $543,000 - $647,000
6
Beds
2
Baths
2,156
Sq Ft
$267/Sq Ft
Est. Value
About This Home
This home is located at 15 Hancock St, Lawrence, MA 01841 and is currently estimated at $575,016, approximately $266 per square foot. 15 Hancock St is a home located in Essex County with nearby schools including Olive Branch Elementary School, Gerard A. Guilmette School, and School For Exceptional Studies.
Ownership History
Date
Name
Owned For
Owner Type
Purchase Details
Closed on
Feb 8, 2019
Sold by
Mota Rafael C and Mota Angela
Bought by
Acosta Janelly
Current Estimated Value
Home Financials for this Owner
Home Financials are based on the most recent Mortgage that was taken out on this home.
Original Mortgage
$281,310
Outstanding Balance
$247,322
Interest Rate
4.5%
Mortgage Type
FHA
Estimated Equity
$327,694
Purchase Details
Closed on
Dec 18, 1992
Sold by
Community Sb
Bought by
Mota Rafael C
Home Financials for this Owner
Home Financials are based on the most recent Mortgage that was taken out on this home.
Original Mortgage
$30,000
Interest Rate
8.3%
Mortgage Type
Purchase Money Mortgage
Purchase Details
Closed on
Jul 11, 1988
Sold by
Cruz Maria
Bought by
Fagan William
Create a Home Valuation Report for This Property
The Home Valuation Report is an in-depth analysis detailing your home's value as well as a comparison with similar homes in the area
Home Values in the Area
Average Home Value in this Area
Purchase History
| Date | Buyer | Sale Price | Title Company |
|---|---|---|---|
| Acosta Janelly | $286,500 | -- | |
| Mota Rafael C | $16,000 | -- | |
| Fagan William | $41,000 | -- |
Source: Public Records
Mortgage History
| Date | Status | Borrower | Loan Amount |
|---|---|---|---|
| Open | Acosta Janelly | $281,310 | |
| Previous Owner | Fagan William | $30,000 | |
| Previous Owner | Fagan William | $50,000 |
Source: Public Records
Tax History Compared to Growth
Tax History
| Year | Tax Paid | Tax Assessment Tax Assessment Total Assessment is a certain percentage of the fair market value that is determined by local assessors to be the total taxable value of land and additions on the property. | Land | Improvement |
|---|---|---|---|---|
| 2025 | $4,650 | $528,400 | $114,500 | $413,900 |
| 2024 | $3,987 | $431,000 | $120,300 | $310,700 |
| 2023 | $4,040 | $397,600 | $116,100 | $281,500 |
| 2022 | $3,863 | $337,700 | $109,500 | $228,200 |
| 2021 | $3,837 | $312,700 | $109,500 | $203,200 |
| 2020 | $3,437 | $276,500 | $91,300 | $185,200 |
| 2019 | $3,502 | $256,000 | $67,800 | $188,200 |
| 2018 | $3,238 | $226,100 | $61,400 | $164,700 |
| 2017 | $3,054 | $199,100 | $58,200 | $140,900 |
| 2016 | $2,922 | $188,400 | $45,500 | $142,900 |
| 2015 | $2,806 | $185,600 | $45,500 | $140,100 |
Source: Public Records
Map
Nearby Homes
- 45 Bodwell St
- 55-59 Water St
- 12 Merrimack View Ct
- 95 Hancock St
- 82 Water St
- 30-32 Linden St
- 70 Butler St
- 44-46 Butler St
- 62-66 Butler St
- 312 Water St Unit 36
- 1008 Essex St Unit 1010
- 265 Ames St
- 499 Haverhill St
- 42 Morton St
- 18 Ames St
- 202 Broadway Unit 2-3
- 202 Broadway Unit 3-3
- 50 Forest St
- 439-443 Riverside Dr
- 450 Riverside Dr Unit 1
- 13 Hancock St
- 9 Hancock St Unit 11
- 32 Bodwell St Unit 34
- 23 Hancock St Unit 27
- 23-27 Hancock St
- 26-28 Bodwell St
- 38 Bodwell St Unit 42
- 50 Bodwell St Unit 52
- 18 Hancock St
- 20-24 Bodwell St
- 22 Hancock St
- 20 Bodwell St Unit 24
- 6 Hancock St Unit 16
- 6-16 Hancock St
- 26 Bodwell St Unit 28
- 14 Bodwell St
- 3 Hancock St
- 3 Hancock St Unit 3
- 10 Freeman Ct
- 54 Bodwell St