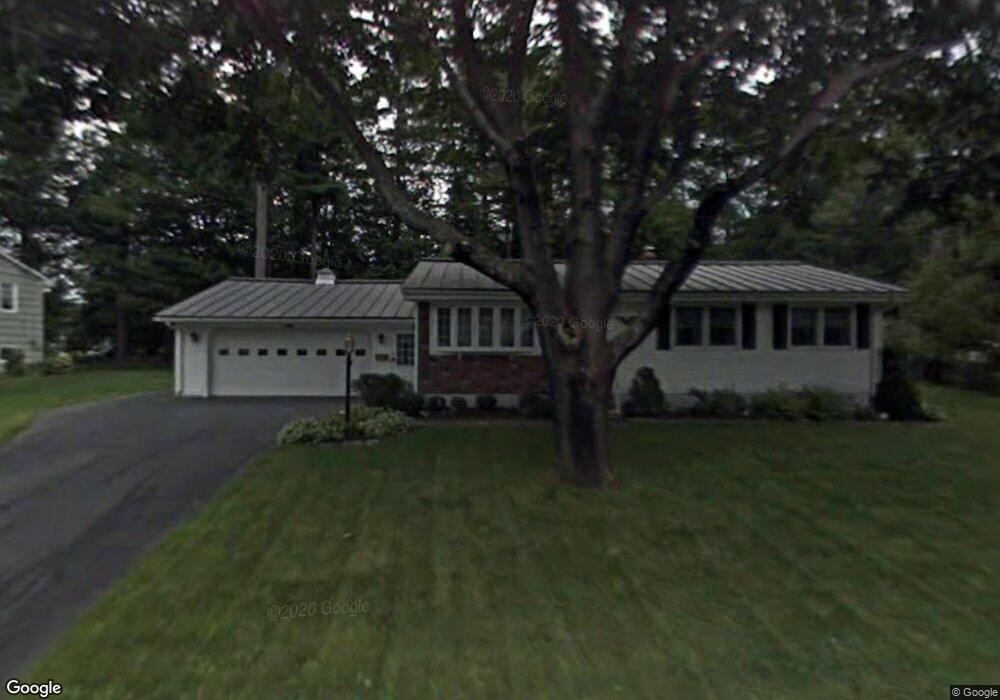
15 Hanson Dr Topsham, ME 04086
Estimated Value: $382,000 - $426,000
2
Beds
1
Bath
1,000
Sq Ft
$396/Sq Ft
Est. Value
About This Home
This home is located at 15 Hanson Dr, Topsham, ME 04086 and is currently estimated at $396,077, approximately $396 per square foot. 15 Hanson Dr is a home located in Sagadahoc County with nearby schools including Mt Ararat High School, Harpswell Coastal Academy Divisions 2 and 3, and St. John's Catholic School.
Ownership History
Date
Name
Owned For
Owner Type
Purchase Details
Closed on
Apr 29, 2025
Sold by
Larrabee Sr Joseph W Est and Larrabee
Bought by
Larrabee Joseph W
Current Estimated Value
Purchase Details
Closed on
Jan 18, 2018
Sold by
Topsham Mobile Home Sales
Bought by
Hilton Cynthia J
Home Financials for this Owner
Home Financials are based on the most recent Mortgage that was taken out on this home.
Original Mortgage
$139,000
Interest Rate
3.94%
Mortgage Type
Unknown
Create a Home Valuation Report for This Property
The Home Valuation Report is an in-depth analysis detailing your home's value as well as a comparison with similar homes in the area
Home Values in the Area
Average Home Value in this Area
Purchase History
| Date | Buyer | Sale Price | Title Company |
|---|---|---|---|
| Larrabee Joseph W | -- | None Available | |
| Larrabee Joseph W | -- | None Available | |
| Hilton Cynthia J | -- | -- | |
| Hilton Cynthia J | -- | -- |
Source: Public Records
Mortgage History
| Date | Status | Borrower | Loan Amount |
|---|---|---|---|
| Previous Owner | Hilton Cynthia J | $139,000 |
Source: Public Records
Tax History Compared to Growth
Tax History
| Year | Tax Paid | Tax Assessment Tax Assessment Total Assessment is a certain percentage of the fair market value that is determined by local assessors to be the total taxable value of land and additions on the property. | Land | Improvement |
|---|---|---|---|---|
| 2025 | $4,251 | $332,100 | $76,300 | $255,800 |
| 2024 | $4,111 | $328,900 | $70,700 | $258,200 |
| 2023 | $3,892 | $286,600 | $67,400 | $219,200 |
| 2022 | $3,572 | $247,700 | $65,000 | $182,700 |
| 2021 | $3,556 | $224,100 | $59,700 | $164,400 |
| 2020 | $3,459 | $193,700 | $59,700 | $134,000 |
| 2019 | $3,499 | $182,700 | $59,700 | $123,000 |
| 2018 | $3,023 | $161,400 | $48,900 | $112,500 |
| 2017 | $2,925 | $161,400 | $48,900 | $112,500 |
| 2016 | $2,882 | $160,200 | $48,900 | $111,300 |
| 2015 | $2,809 | $156,400 | $48,900 | $107,500 |
| 2014 | $2,690 | $155,200 | $48,900 | $106,300 |
| 2013 | $2,584 | $155,200 | $48,900 | $106,300 |
Source: Public Records
Map
Nearby Homes