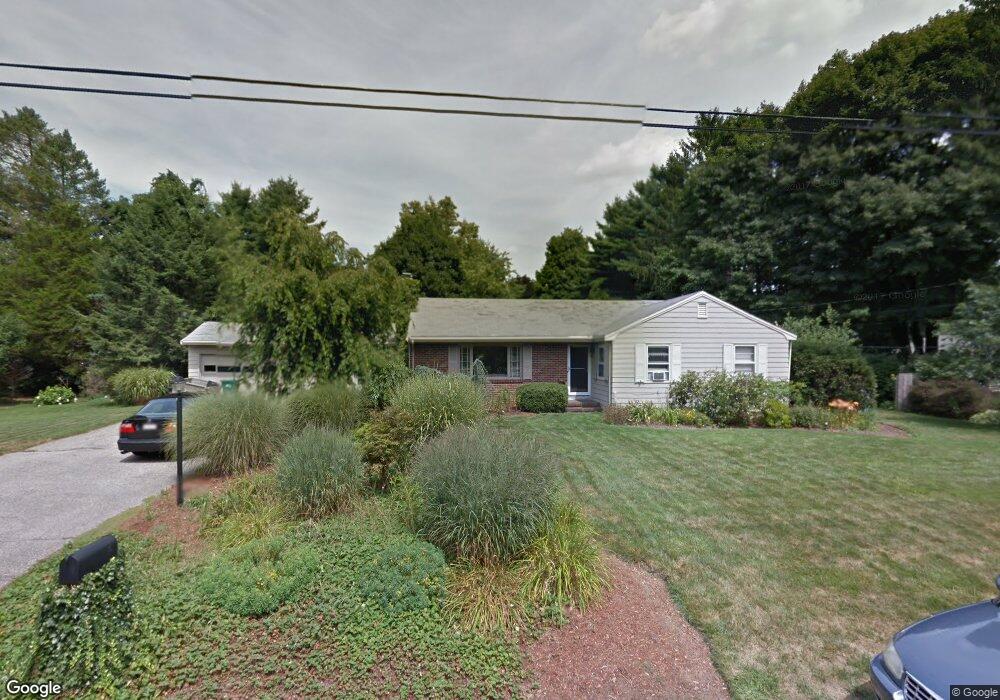
15 Hatch Rd Attleboro, MA 02703
Estimated Value: $623,577 - $650,000
4
Beds
2
Baths
1,878
Sq Ft
$339/Sq Ft
Est. Value
About This Home
This home is located at 15 Hatch Rd, Attleboro, MA 02703 and is currently estimated at $636,644, approximately $339 per square foot. 15 Hatch Rd is a home located in Bristol County with nearby schools including A. Irvin Studley Elementary School, Cyril K. Brennan Middle School, and Attleboro High School.
Ownership History
Date
Name
Owned For
Owner Type
Purchase Details
Closed on
Jan 19, 2022
Sold by
Galindo Vladimir and Samson Audrey
Bought by
Samson Galindo Ft
Current Estimated Value
Purchase Details
Closed on
Apr 3, 1998
Sold by
Nordberg Roy W
Bought by
Galindo Vladimir and Samson Audrey
Purchase Details
Closed on
Dec 21, 1992
Sold by
Grourke Joseph E
Bought by
Nordberg Roy W and Horvath Michale L
Create a Home Valuation Report for This Property
The Home Valuation Report is an in-depth analysis detailing your home's value as well as a comparison with similar homes in the area
Home Values in the Area
Average Home Value in this Area
Purchase History
| Date | Buyer | Sale Price | Title Company |
|---|---|---|---|
| Samson Galindo Ft | -- | None Available | |
| Galindo Vladimir | $150,000 | -- | |
| Nordberg Roy W | $150,000 | -- |
Source: Public Records
Mortgage History
| Date | Status | Borrower | Loan Amount |
|---|---|---|---|
| Previous Owner | Nordberg Roy W | $30,000 | |
| Previous Owner | Nordberg Roy W | $162,000 | |
| Previous Owner | Nordberg Roy W | $165,000 |
Source: Public Records
Tax History Compared to Growth
Tax History
| Year | Tax Paid | Tax Assessment Tax Assessment Total Assessment is a certain percentage of the fair market value that is determined by local assessors to be the total taxable value of land and additions on the property. | Land | Improvement |
|---|---|---|---|---|
| 2025 | $6,970 | $555,400 | $174,300 | $381,100 |
| 2024 | $6,499 | $510,500 | $156,900 | $353,600 |
| 2023 | $6,359 | $464,500 | $158,500 | $306,000 |
| 2022 | $6,092 | $421,600 | $151,100 | $270,500 |
| 2021 | $5,612 | $379,200 | $145,300 | $233,900 |
| 2020 | $5,422 | $372,400 | $138,700 | $233,700 |
| 2019 | $5,183 | $366,000 | $136,100 | $229,900 |
| 2018 | $7,658 | $341,200 | $132,100 | $209,100 |
| 2017 | $4,628 | $318,100 | $128,700 | $189,400 |
| 2016 | $4,284 | $289,100 | $120,100 | $169,000 |
| 2015 | $4,286 | $291,400 | $120,100 | $171,300 |
| 2014 | $3,992 | $268,800 | $114,900 | $153,900 |
Source: Public Records
Map
Nearby Homes