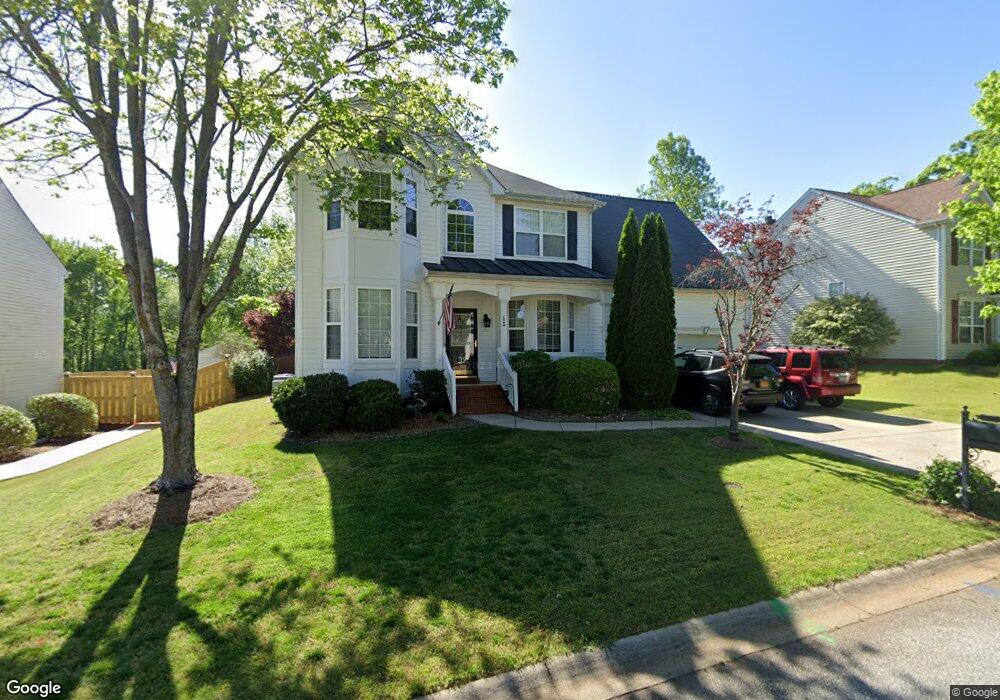
15 Heather Stone Ct Simpsonville, SC 29680
Estimated Value: $353,786 - $368,000
4
Beds
3
Baths
2,519
Sq Ft
$143/Sq Ft
Est. Value
About This Home
This home is located at 15 Heather Stone Ct, Simpsonville, SC 29680 and is currently estimated at $360,947, approximately $143 per square foot. 15 Heather Stone Ct is a home located in Greenville County with nearby schools including Bryson Elementary School, Bryson Middle School, and Hillcrest High School.
Ownership History
Date
Name
Owned For
Owner Type
Purchase Details
Closed on
Jul 12, 2016
Sold by
Harper Melanie E
Bought by
Drake Daniel W
Current Estimated Value
Home Financials for this Owner
Home Financials are based on the most recent Mortgage that was taken out on this home.
Original Mortgage
$188,005
Outstanding Balance
$149,891
Interest Rate
3.54%
Mortgage Type
New Conventional
Estimated Equity
$211,056
Purchase Details
Closed on
Feb 24, 2016
Sold by
Harper Thomas A
Bought by
Harper Melanie E
Purchase Details
Closed on
Aug 29, 2008
Sold by
Cason Mark A and Cason Tracey P
Bought by
Harper Thomas A and Harper Melanie E
Home Financials for this Owner
Home Financials are based on the most recent Mortgage that was taken out on this home.
Original Mortgage
$172,975
Interest Rate
6.61%
Mortgage Type
FHA
Purchase Details
Closed on
May 17, 2001
Sold by
Saleigha Family Trust By Trustees
Bought by
Cason Mark A
Create a Home Valuation Report for This Property
The Home Valuation Report is an in-depth analysis detailing your home's value as well as a comparison with similar homes in the area
Home Values in the Area
Average Home Value in this Area
Purchase History
| Date | Buyer | Sale Price | Title Company |
|---|---|---|---|
| Drake Daniel W | $197,900 | Real Estate | |
| Harper Melanie E | -- | None Available | |
| Harper Thomas A | $175,900 | -- | |
| Cason Mark A | -- | -- |
Source: Public Records
Mortgage History
| Date | Status | Borrower | Loan Amount |
|---|---|---|---|
| Open | Drake Daniel W | $188,005 | |
| Previous Owner | Harper Thomas A | $172,975 |
Source: Public Records
Tax History Compared to Growth
Tax History
| Year | Tax Paid | Tax Assessment Tax Assessment Total Assessment is a certain percentage of the fair market value that is determined by local assessors to be the total taxable value of land and additions on the property. | Land | Improvement |
|---|---|---|---|---|
| 2024 | $986 | $8,190 | $1,200 | $6,990 |
| 2023 | $986 | $8,190 | $1,200 | $6,990 |
| 2022 | $962 | $8,190 | $1,200 | $6,990 |
| 2021 | $962 | $8,190 | $1,200 | $6,990 |
| 2020 | $882 | $7,350 | $1,040 | $6,310 |
| 2019 | $1,197 | $7,350 | $1,040 | $6,310 |
| 2018 | $1,242 | $7,350 | $1,040 | $6,310 |
| 2017 | $1,244 | $7,350 | $1,040 | $6,310 |
| 2016 | $1,197 | $183,720 | $26,000 | $157,720 |
| 2015 | $1,199 | $183,720 | $26,000 | $157,720 |
| 2014 | $1,088 | $174,780 | $25,000 | $149,780 |
Source: Public Records
Map
Nearby Homes
- 22 Heather Stone Ct
- 102 Waterton Way
- 213 Fairview Lake Way
- 101 Stonewater Dr
- 326 Waterton Way
- 2 Crossview Dr
- 17 Starlake Rd
- 112 Addington Ln
- 810 Fairview Rd
- 3 Heatherfield Dr
- 214 Rivers Edge Cir
- Durham Plan at Fairview Village - Townhomes
- Cary Plan at Fairview Village - Townhomes
- Bristol Plan at Fairview Village - Townhomes
- 19 Fair Village Ln
- 4 Lenten Rose Ct
- 39 Fair Village Ln
- 1 Allamanda Way
- 49 Fair Village Ln
- 51 Fair Village Ln
- 11 Heather Stone Ct
- 17 Heather Stone Ct
- 19 Heather Stone Ct
- 9 Heather Stone Ct
- 10 Heather Stone Ct
- 8 Heather Stone Ct
- 12 Heather Stone Ct
- 21 Heather Stone Ct
- 14 Heather Stone Ct
- 7 Heather Stone Ct
- 6 Heather Stone Ct
- 16 Heather Stone Ct
- 23 Heather Stone Ct
- 4 Heather Stone Ct
- 116 Waterton Way
- 5 Heather Stone Ct
- 118 Waterton Way
- 114 Waterton Way
- 120 Waterton Way
- 112 Waterton Way