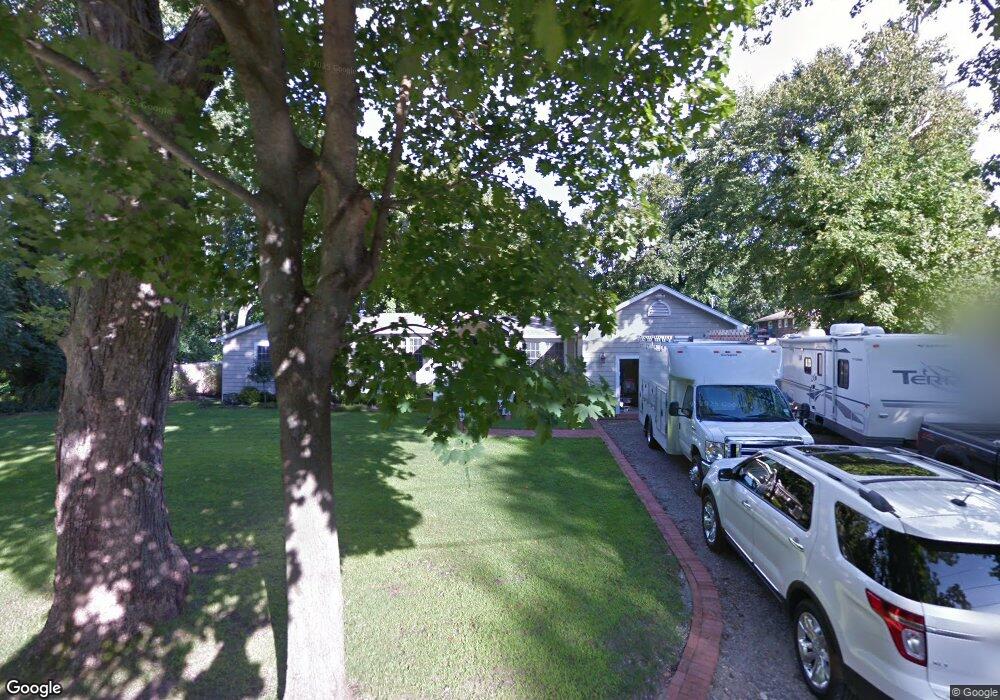
15 Hedges Rd East Patchogue, NY 11772
Estimated Value: $602,835 - $658,000
3
Beds
1
Bath
1,659
Sq Ft
$379/Sq Ft
Est. Value
About This Home
This home is located at 15 Hedges Rd, East Patchogue, NY 11772 and is currently estimated at $629,459, approximately $379 per square foot. 15 Hedges Rd is a home located in Suffolk County with nearby schools including Frank P Long Intermediate School, Bellport Middle School, and Bellport Senior High School.
Ownership History
Date
Name
Owned For
Owner Type
Purchase Details
Closed on
Feb 26, 2004
Sold by
Gaynor William T
Bought by
Gaynor William T and Gaynor Katherine A
Current Estimated Value
Home Financials for this Owner
Home Financials are based on the most recent Mortgage that was taken out on this home.
Original Mortgage
$291,900
Outstanding Balance
$136,803
Interest Rate
5.71%
Mortgage Type
FHA
Estimated Equity
$492,656
Purchase Details
Closed on
Aug 29, 2000
Sold by
Port Realty Group Llc
Bought by
Alarcon Omar A
Home Financials for this Owner
Home Financials are based on the most recent Mortgage that was taken out on this home.
Original Mortgage
$183,027
Interest Rate
7.76%
Mortgage Type
FHA
Purchase Details
Closed on
Oct 20, 1999
Sold by
Varney Anthony and Varney Doreen
Bought by
Port Realty Group Llc
Purchase Details
Closed on
Aug 20, 1999
Sold by
Luna Barbara M and Jacobus John H
Bought by
Varney Anthony and Varney Doreen
Create a Home Valuation Report for This Property
The Home Valuation Report is an in-depth analysis detailing your home's value as well as a comparison with similar homes in the area
Home Values in the Area
Average Home Value in this Area
Purchase History
| Date | Buyer | Sale Price | Title Company |
|---|---|---|---|
| Gaynor William T | -- | Commonwealth Title | |
| Gaynor William T | $296,500 | First American Title Ins Co | |
| Alarcon Omar A | $199,000 | Titleguard Inc | |
| Port Realty Group Llc | $117,000 | First American Title Ins Co | |
| Varney Anthony | $60,000 | First New York Title & Abstr |
Source: Public Records
Mortgage History
| Date | Status | Borrower | Loan Amount |
|---|---|---|---|
| Open | Gaynor William T | $291,900 | |
| Previous Owner | Alarcon Omar A | $183,027 |
Source: Public Records
Tax History
| Year | Tax Paid | Tax Assessment Tax Assessment Total Assessment is a certain percentage of the fair market value that is determined by local assessors to be the total taxable value of land and additions on the property. | Land | Improvement |
|---|---|---|---|---|
| 2024 | $9,115 | $2,300 | $275 | $2,025 |
| 2023 | $9,115 | $2,300 | $275 | $2,025 |
| 2022 | $8,282 | $2,300 | $275 | $2,025 |
| 2021 | $8,282 | $2,300 | $275 | $2,025 |
| 2020 | $8,560 | $2,300 | $275 | $2,025 |
| 2019 | $8,560 | $0 | $0 | $0 |
| 2018 | $8,112 | $2,300 | $275 | $2,025 |
| 2017 | $8,112 | $2,300 | $275 | $2,025 |
| 2016 | $8,088 | $2,300 | $275 | $2,025 |
| 2015 | -- | $2,300 | $275 | $2,025 |
| 2014 | -- | $2,300 | $275 | $2,025 |
Source: Public Records
Map
Nearby Homes
- 3 Moss Creek Ln
- 85 Bayview Ave
- 190 N Dunton Ave
- 163 Orchard Rd
- 247 N Dunton Ave
- 262 N Dunton Ave
- 156 Clinton Ave
- 0 Bayview Ave
- 12 Summit St
- 36 Roosevelt Blvd
- 39 Roosevelt Blvd
- 164 Donegan Ave
- 0 Walker Ave
- 188 Donegan Ave
- 214 Donegan Ave
- 239 Bayview Ave
- 149 Munsell Rd
- 15 Oak Rd
- 405 Kane Ave
- 257 Union Ave
- 599 S Country Rd
- 14 Hedges Rd
- 21 Hedges Rd
- 605 S Country Rd
- 591 S Country Rd
- 581 S Country Rd
- 617 S Country Rd
- 1 Esplanade Dr
- 2 Moss Creek Ln
- 25 Hedges Rd
- 1 Esplanade Dr
- 2 Woodhill Cir
- 573 S Country Rd
- 42 Furman Ave
- 32 Furman Ave
- 48 Furman Ave
- 56 Hedges Rd
- 635 S Country Rd
- 4 Moss Creek Ln
- 54 Furman Ave
Your Personal Tour Guide
Ask me questions while you tour the home.