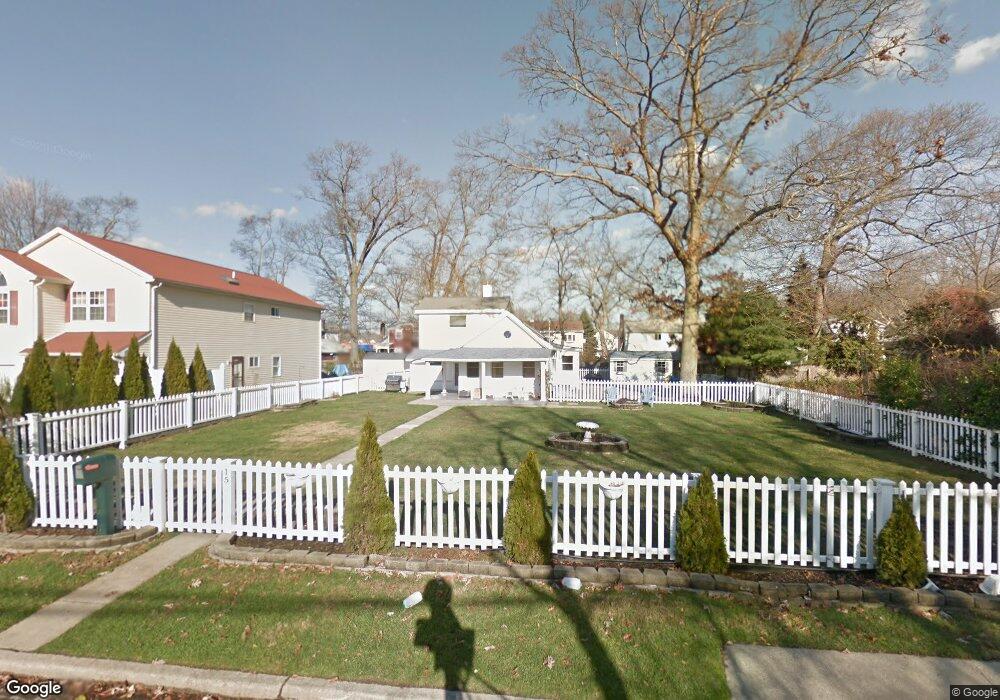
15 Hemlock St Massapequa, NY 11758
Estimated Value: $573,000 - $664,117
3
Beds
1
Bath
988
Sq Ft
$626/Sq Ft
Est. Value
About This Home
This home is located at 15 Hemlock St, Massapequa, NY 11758 and is currently estimated at $618,559, approximately $626 per square foot. 15 Hemlock St is a home located in Nassau County with nearby schools including Northeast Elementary School, Northwest Elementary School, and Park Avenue Memorial Elementary School.
Ownership History
Date
Name
Owned For
Owner Type
Purchase Details
Closed on
Mar 3, 2016
Sold by
Freer Clifford W and Freer Jennifer M
Bought by
Romano Jon
Current Estimated Value
Home Financials for this Owner
Home Financials are based on the most recent Mortgage that was taken out on this home.
Original Mortgage
$214,000
Outstanding Balance
$169,773
Interest Rate
3.72%
Mortgage Type
VA
Estimated Equity
$448,786
Purchase Details
Closed on
Nov 25, 2002
Sold by
Shah Bharat
Bought by
Freer Clifford
Create a Home Valuation Report for This Property
The Home Valuation Report is an in-depth analysis detailing your home's value as well as a comparison with similar homes in the area
Home Values in the Area
Average Home Value in this Area
Purchase History
| Date | Buyer | Sale Price | Title Company |
|---|---|---|---|
| Romano Jon | $228,000 | None Available | |
| Freer Clifford | $221,215 | -- |
Source: Public Records
Mortgage History
| Date | Status | Borrower | Loan Amount |
|---|---|---|---|
| Open | Romano Jon | $214,000 |
Source: Public Records
Tax History Compared to Growth
Tax History
| Year | Tax Paid | Tax Assessment Tax Assessment Total Assessment is a certain percentage of the fair market value that is determined by local assessors to be the total taxable value of land and additions on the property. | Land | Improvement |
|---|---|---|---|---|
| 2025 | $8,944 | $282 | $157 | $125 |
| 2024 | $2,372 | $282 | $157 | $125 |
| 2023 | $8,273 | $282 | $157 | $125 |
| 2022 | $8,273 | $282 | $157 | $125 |
| 2021 | $8,626 | $273 | $152 | $121 |
| 2020 | $8,084 | $428 | $427 | $1 |
| 2019 | $8,478 | $428 | $427 | $1 |
| 2018 | $8,141 | $428 | $0 | $0 |
| 2017 | $4,831 | $428 | $427 | $1 |
| 2016 | $6,856 | $428 | $427 | $1 |
| 2015 | $1,814 | $428 | $369 | $59 |
| 2014 | $1,814 | $428 | $369 | $59 |
| 2013 | $1,732 | $450 | $388 | $62 |
Source: Public Records
Map
Nearby Homes