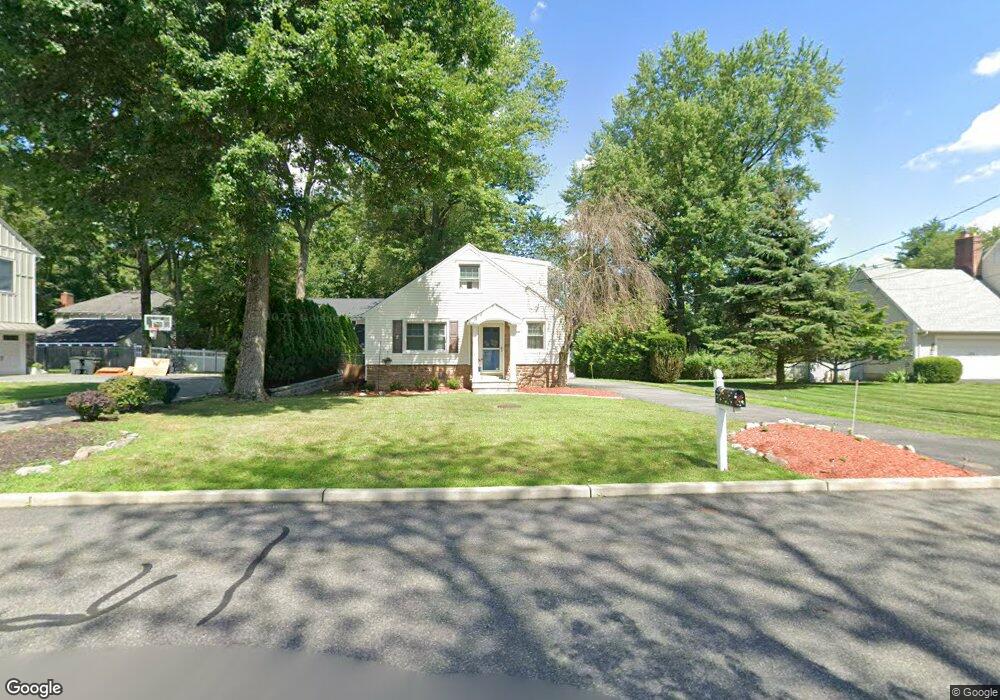
15 High St Mahwah, NJ 07430
Estimated Value: $506,000 - $680,000
--
Bed
--
Bath
1,164
Sq Ft
$509/Sq Ft
Est. Value
About This Home
This home is located at 15 High St, Mahwah, NJ 07430 and is currently estimated at $592,328, approximately $508 per square foot. 15 High St is a home located in Bergen County with nearby schools including Mahwah High School, Guidepost Montessori at Mahwah, and St. Elizabeth School.
Ownership History
Date
Name
Owned For
Owner Type
Purchase Details
Closed on
Jan 20, 2006
Sold by
Quill Lydia
Bought by
Quill Lydia and Weir William
Current Estimated Value
Home Financials for this Owner
Home Financials are based on the most recent Mortgage that was taken out on this home.
Original Mortgage
$322,600
Interest Rate
6.23%
Purchase Details
Closed on
Dec 12, 2005
Sold by
Hetzel Timothy
Bought by
Quill Lydia and Weir William
Home Financials for this Owner
Home Financials are based on the most recent Mortgage that was taken out on this home.
Original Mortgage
$322,600
Interest Rate
6.23%
Create a Home Valuation Report for This Property
The Home Valuation Report is an in-depth analysis detailing your home's value as well as a comparison with similar homes in the area
Home Values in the Area
Average Home Value in this Area
Purchase History
| Date | Buyer | Sale Price | Title Company |
|---|---|---|---|
| Quill Lydia | -- | -- | |
| Quill Lydia | $414,000 | -- |
Source: Public Records
Mortgage History
| Date | Status | Borrower | Loan Amount |
|---|---|---|---|
| Previous Owner | Quill Lydia | $322,600 |
Source: Public Records
Tax History Compared to Growth
Tax History
| Year | Tax Paid | Tax Assessment Tax Assessment Total Assessment is a certain percentage of the fair market value that is determined by local assessors to be the total taxable value of land and additions on the property. | Land | Improvement |
|---|---|---|---|---|
| 2025 | $5,938 | $287,700 | $225,000 | $62,700 |
| 2024 | $5,860 | $287,700 | $225,000 | $62,700 |
| 2023 | $5,673 | $287,700 | $225,000 | $62,700 |
| 2022 | $5,673 | $287,700 | $225,000 | $62,700 |
| 2021 | $5,613 | $287,700 | $225,000 | $62,700 |
| 2020 | $5,478 | $287,700 | $225,000 | $62,700 |
| 2019 | $5,297 | $287,700 | $225,000 | $62,700 |
| 2018 | $5,222 | $287,700 | $225,000 | $62,700 |
| 2017 | $5,138 | $287,700 | $225,000 | $62,700 |
| 2016 | $5,026 | $287,700 | $225,000 | $62,700 |
| 2015 | $4,957 | $287,700 | $225,000 | $62,700 |
| 2014 | $4,874 | $287,700 | $225,000 | $62,700 |
Source: Public Records
Map
Nearby Homes
- 796 Wyckoff Ave
- 7 Sandburg Ct
- 21 Whitman Ln
- 93 Frost Ln
- 97 Frost Ln
- 23 Herlihy Dr
- 10 Watch Hill Rd
- 278 Crest Place
- 314 Meadowbrook Rd
- 176 Delhagen Ct
- 502 Timberline Dr
- 436D Bromley Place
- 505 Timberline Dr
- 444B Bromley Place Unit B
- 444B Bromley Place
- 24 Vanderbeck Ln
- 103 Macintyre Ln
- 80 Konight Ct
- 600 Pulis Ave Unit 83
- 600 Pulis Ave