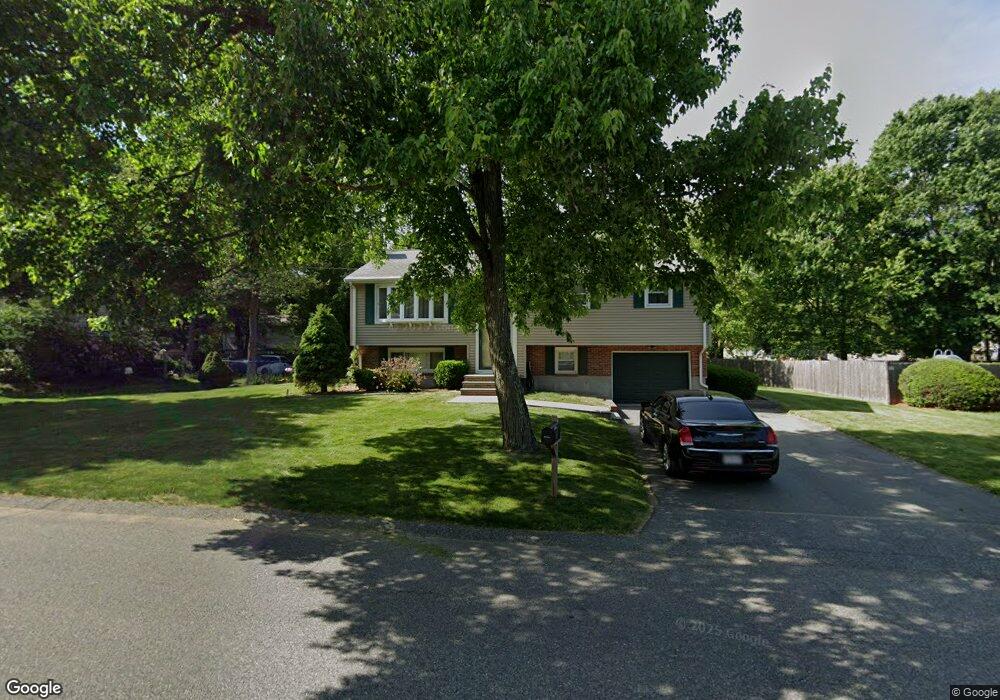
15 Highfield Dr Brockton, MA 02301
Clifton Heights NeighborhoodEstimated Value: $586,707 - $598,000
3
Beds
2
Baths
1,868
Sq Ft
$318/Sq Ft
Est. Value
About This Home
This home is located at 15 Highfield Dr, Brockton, MA 02301 and is currently estimated at $594,177, approximately $318 per square foot. 15 Highfield Dr is a home located in Plymouth County with nearby schools including Gilmore Elementary School, John F. Kennedy Elementary School, and Davis K-8 School.
Ownership History
Date
Name
Owned For
Owner Type
Purchase Details
Closed on
Jul 1, 1993
Sold by
Moskofides Ioannis and Moskofides Sotiria
Bought by
Henry Dennis M and Quinlan Lisa M
Current Estimated Value
Purchase Details
Closed on
Jun 6, 1989
Sold by
Moskofides Miltos
Bought by
Moskofides Ioannis
Create a Home Valuation Report for This Property
The Home Valuation Report is an in-depth analysis detailing your home's value as well as a comparison with similar homes in the area
Home Values in the Area
Average Home Value in this Area
Purchase History
| Date | Buyer | Sale Price | Title Company |
|---|---|---|---|
| Henry Dennis M | $123,500 | -- | |
| Moskofides Ioannis | $90,000 | -- |
Source: Public Records
Mortgage History
| Date | Status | Borrower | Loan Amount |
|---|---|---|---|
| Open | Moskofides Ioannis | $115,000 | |
| Closed | Moskofides Ioannis | $100,000 |
Source: Public Records
Tax History Compared to Growth
Tax History
| Year | Tax Paid | Tax Assessment Tax Assessment Total Assessment is a certain percentage of the fair market value that is determined by local assessors to be the total taxable value of land and additions on the property. | Land | Improvement |
|---|---|---|---|---|
| 2025 | $6,186 | $510,800 | $145,000 | $365,800 |
| 2024 | $6,068 | $504,800 | $145,000 | $359,800 |
| 2023 | $6,036 | $465,000 | $110,000 | $355,000 |
| 2022 | $5,514 | $394,700 | $100,000 | $294,700 |
| 2021 | $5,146 | $354,900 | $95,000 | $259,900 |
| 2020 | $5,093 | $336,200 | $91,000 | $245,200 |
| 2019 | $5,423 | $349,000 | $85,500 | $263,500 |
| 2018 | $5,016 | $312,300 | $85,500 | $226,800 |
| 2017 | $4,358 | $270,700 | $85,500 | $185,200 |
| 2016 | $4,583 | $264,000 | $81,500 | $182,500 |
| 2015 | $4,285 | $236,100 | $81,500 | $154,600 |
| 2014 | $4,529 | $249,800 | $81,500 | $168,300 |
Source: Public Records
Map
Nearby Homes