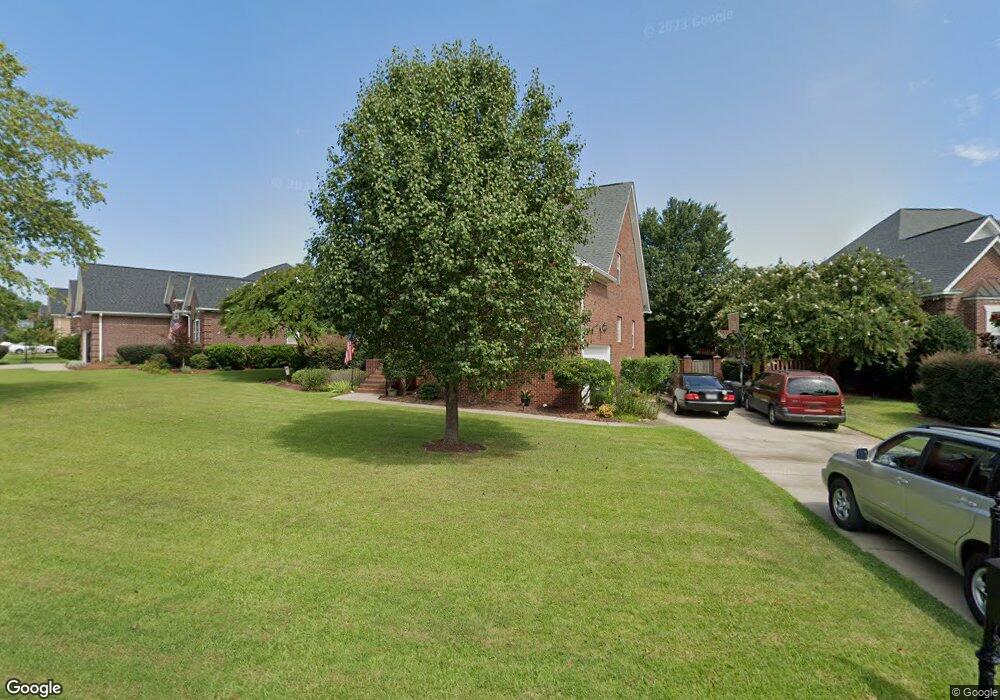
15 Hilton Glen Ct Chapin, SC 29036
Estimated Value: $424,717 - $454,000
3
Beds
3
Baths
2,568
Sq Ft
$171/Sq Ft
Est. Value
About This Home
This home is located at 15 Hilton Glen Ct, Chapin, SC 29036 and is currently estimated at $439,179, approximately $171 per square foot. 15 Hilton Glen Ct is a home located in Lexington County with nearby schools including Lake Murray Elementary School, Chapin Intermediate, and Chapin High School.
Ownership History
Date
Name
Owned For
Owner Type
Purchase Details
Closed on
Feb 10, 2010
Sold by
Wallace Gregory B and Wallace Tammy L
Bought by
White Mark A and White Suzanne J
Current Estimated Value
Home Financials for this Owner
Home Financials are based on the most recent Mortgage that was taken out on this home.
Original Mortgage
$203,000
Outstanding Balance
$135,223
Interest Rate
5.16%
Mortgage Type
New Conventional
Estimated Equity
$303,956
Purchase Details
Closed on
Jul 21, 2003
Sold by
Slice David Troy
Bought by
Wallace Gregory B and Wallace Tammy L
Home Financials for this Owner
Home Financials are based on the most recent Mortgage that was taken out on this home.
Original Mortgage
$162,550
Interest Rate
5.16%
Mortgage Type
Purchase Money Mortgage
Purchase Details
Closed on
Jul 2, 2003
Sold by
Green Earth Development Llc
Bought by
Hackett Michael D and Hackett Ginger D
Home Financials for this Owner
Home Financials are based on the most recent Mortgage that was taken out on this home.
Original Mortgage
$162,550
Interest Rate
5.16%
Mortgage Type
Purchase Money Mortgage
Create a Home Valuation Report for This Property
The Home Valuation Report is an in-depth analysis detailing your home's value as well as a comparison with similar homes in the area
Home Values in the Area
Average Home Value in this Area
Purchase History
| Date | Buyer | Sale Price | Title Company |
|---|---|---|---|
| White Mark A | $267,500 | -- | |
| Wallace Gregory B | $240,550 | -- | |
| Hackett Michael D | $30,900 | -- |
Source: Public Records
Mortgage History
| Date | Status | Borrower | Loan Amount |
|---|---|---|---|
| Open | White Mark A | $203,000 | |
| Previous Owner | Wallace Gregory B | $162,550 | |
| Previous Owner | Hackett Michael D | $253,800 |
Source: Public Records
Tax History Compared to Growth
Tax History
| Year | Tax Paid | Tax Assessment Tax Assessment Total Assessment is a certain percentage of the fair market value that is determined by local assessors to be the total taxable value of land and additions on the property. | Land | Improvement |
|---|---|---|---|---|
| 2024 | $2,453 | $286,600 | $0 | $0 |
| 2023 | $2,358 | $9,968 | $0 | $0 |
| 2022 | $2,045 | $249,200 | $42,000 | $207,200 |
| 2021 | $2,067 | $9,970 | $0 | $0 |
| 2020 | $2,163 | $9,970 | $0 | $0 |
| 2019 | $2,150 | $9,970 | $0 | $0 |
| 2018 | $1,733 | $8,920 | $0 | $0 |
| 2017 | $1,688 | $8,920 | $0 | $0 |
| 2016 | $1,679 | $8,920 | $0 | $0 |
| 2015 | $1,688 | $8,920 | $0 | $0 |
| 2014 | $1,684 | $223,000 | $0 | $0 |
| 2013 | -- | $8,920 | $0 | $0 |
Source: Public Records
Map
Nearby Homes
- 306 Dolly Horn Ln
- 110 Lake Hilton Dr
- 138 Sunsation Dr
- 275 Hilton Village Dr
- 2207 Wessinger Rd
- 551 Village Church Dr
- 24 Clay Ct
- 129 Forest Bickley Rd
- 2515 Wessinger Rd
- 308 Grannys Cut Way
- 630 Basalt Ct
- The Bancroft Plan at Chapin Place
- 304 Racket Rd
- 2544 Wessinger Rd
- Lot 4 Lake Breeze
- 1208 Peace Haven Rd
- 419 Dolomite Ct
- 2033 Old Hilton Rd
- 444 Dolomite Ct
- 2006 Old Hilton Rd
- 11 Hilton Glen Ct
- 16 Hilton Glen Ct
- 17 Hilton Glen Ct
- 9 Hilton Glen Ct
- 12 Hilton Glen Ct
- 10 Hilton Glen Ct
- 14 Hilton Glen Ct
- 8 Hilton Glen Ct
- 7 Hilton Glen Ct
- 19 Hilton Glen Ct
- 21 Hilton Commons Ct
- 18 Hilton Glen Ct
- 17 Hilton Commons Ct
- 6 Hilton Glen Ct
- 23 Hilton Commons Ct
- 5 Hilton Glen Ct
- 15 Hilton Commons Ct
- 25 Hilton Commons Ct
- 22 Hilton Glen Ct
- 4 Hilton Glen Ct