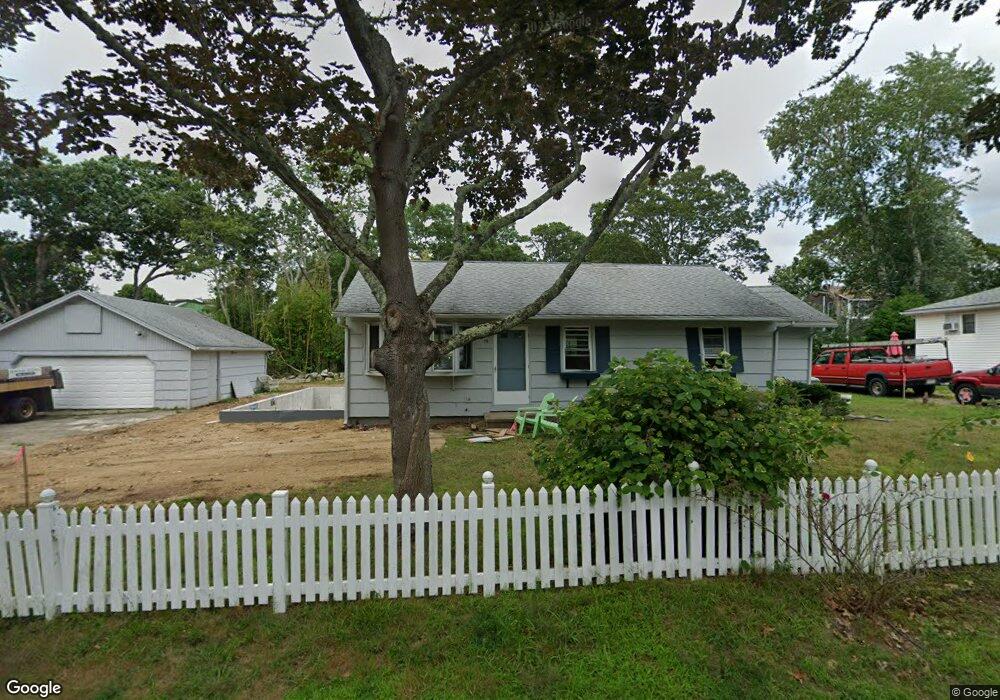
15 Hunt St North Falmouth, MA 02556
North Falmouth NeighborhoodEstimated Value: $1,020,000 - $1,274,000
3
Beds
3
Baths
1,814
Sq Ft
$611/Sq Ft
Est. Value
About This Home
This home is located at 15 Hunt St, North Falmouth, MA 02556 and is currently estimated at $1,109,260, approximately $611 per square foot. 15 Hunt St is a home located in Barnstable County with nearby schools including North Falmouth Elementary School, Morse Pond School, and Lawrence School.
Ownership History
Date
Name
Owned For
Owner Type
Purchase Details
Closed on
Jun 28, 2023
Sold by
Obrien Gaynor M
Bought by
Obrien Michael L and Mcmenamy-Obrien Lauren K
Current Estimated Value
Purchase Details
Closed on
Jul 9, 2013
Sold by
Obrien Gaynor M
Bought by
Obrien Irt and Obrien
Create a Home Valuation Report for This Property
The Home Valuation Report is an in-depth analysis detailing your home's value as well as a comparison with similar homes in the area
Home Values in the Area
Average Home Value in this Area
Purchase History
| Date | Buyer | Sale Price | Title Company |
|---|---|---|---|
| Obrien Michael L | -- | None Available | |
| Obrien Gaynor M | -- | None Available | |
| Obrien Irt | -- | -- | |
| Obrien Irt | -- | -- | |
| Obrien Irt | -- | -- |
Source: Public Records
Tax History Compared to Growth
Tax History
| Year | Tax Paid | Tax Assessment Tax Assessment Total Assessment is a certain percentage of the fair market value that is determined by local assessors to be the total taxable value of land and additions on the property. | Land | Improvement |
|---|---|---|---|---|
| 2025 | $5,618 | $957,100 | $429,700 | $527,400 |
| 2024 | $3,911 | $622,700 | $390,600 | $232,100 |
| 2023 | $3,549 | $512,900 | $312,500 | $200,400 |
| 2022 | $3,492 | $433,800 | $258,800 | $175,000 |
| 2021 | $3,448 | $405,600 | $247,500 | $158,100 |
| 2020 | $3,291 | $383,100 | $225,000 | $158,100 |
| 2019 | $3,212 | $375,200 | $225,000 | $150,200 |
| 2018 | $3,145 | $365,700 | $225,000 | $140,700 |
| 2017 | $3,083 | $361,400 | $225,000 | $136,400 |
| 2016 | $3,005 | $359,000 | $225,000 | $134,000 |
| 2015 | $2,921 | $356,700 | $225,000 | $131,700 |
| 2014 | $2,908 | $356,800 | $225,100 | $131,700 |
Source: Public Records
Map
Nearby Homes
- 74 Hillside Ave
- 37 Five Gate Ln
- 9 Seascape Ln
- 14 Ryder Rd
- 24 Fiddlers Cove Rd
- 24 Westwood Rd
- 40 Point Rd
- 2 Tricia Rd
- 0 Quaker Rd Unit 22504204
- 0 Quaker Rd Unit 73423088
- 345 Quaker Rd
- 267 N Falmouth Hwy
- 213 N Falmouth Hwy Unit 5A
- 213 N Falmouth Hwy Unit 5B
- 213 N Falmouth Hwy Unit 5 A
- 104 Streeter Hill Rd
- 104 Streeter Hill Rd
- 121 Streeter Hill Rd
- 121 Streeter Hill Rd
- 289 Old Main Rd
- 100 Silver Beach Ave
- 9 Hunt St
- 96 Silver Beach Ave
- 104 Silver Beach Ave
- 20 Hunt St
- 16 Hunt St
- 92 Silver Beach Ave
- 106 Silver Beach Ave
- 10 Hunt St
- 25 Hunt St
- 101 Silver Beach Ave-Winter Rental
- 101 Silver Beach Ave
- 105 Silver Beach Ave
- 110 Silver Beach Ave
- 90 Silver Beach Ave
- 5 Hunt St
- 6 Hunt St
- 29 Hunt St
- 107 Silver Beach Ave
- 112-B Silver Beach Ave