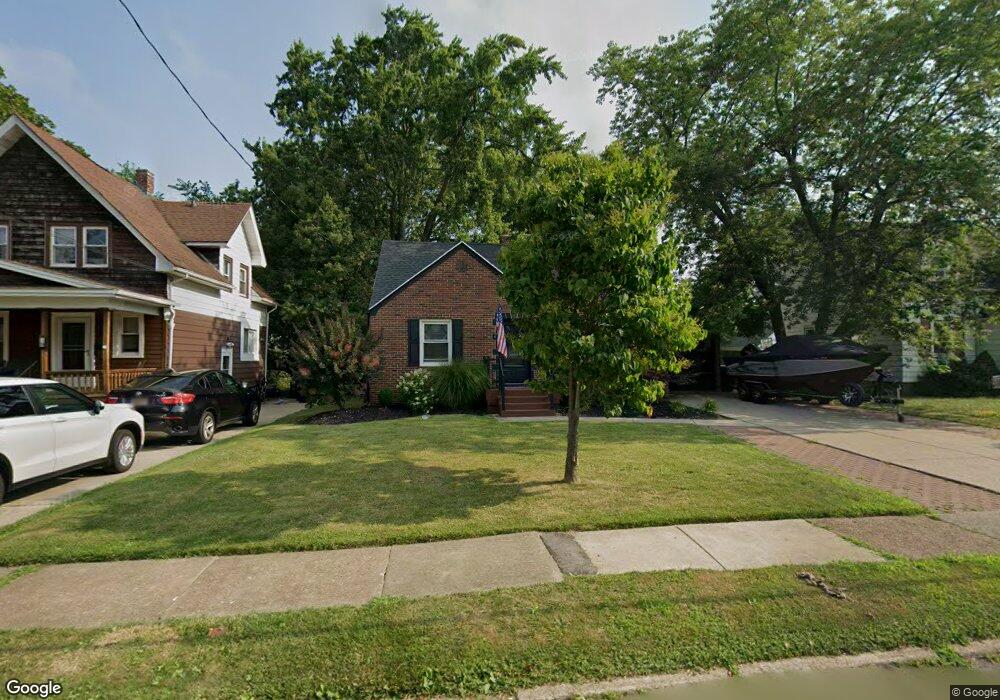
15 Ilion St Tonawanda, NY 14150
Estimated Value: $282,000 - $329,000
3
Beds
2
Baths
1,906
Sq Ft
$158/Sq Ft
Est. Value
About This Home
This home is located at 15 Ilion St, Tonawanda, NY 14150 and is currently estimated at $301,926, approximately $158 per square foot. 15 Ilion St is a home located in Erie County with nearby schools including Mullen Elementary School, Tonawanda Elementary School, and Tonawanda Middle High School.
Ownership History
Date
Name
Owned For
Owner Type
Purchase Details
Closed on
Nov 19, 2021
Sold by
Lc Strategic Realty Llc
Bought by
Bingham Kurt A
Current Estimated Value
Home Financials for this Owner
Home Financials are based on the most recent Mortgage that was taken out on this home.
Original Mortgage
$180,720
Outstanding Balance
$140,357
Interest Rate
2.33%
Mortgage Type
New Conventional
Estimated Equity
$161,569
Purchase Details
Closed on
Jun 4, 2018
Sold by
Ae Buffalo Properties Llc
Bought by
Lc Strategic Realty Llc
Purchase Details
Closed on
May 2, 2018
Sold by
Haller John C
Bought by
Ae Buffalo Ptopeerites Llc
Create a Home Valuation Report for This Property
The Home Valuation Report is an in-depth analysis detailing your home's value as well as a comparison with similar homes in the area
Home Values in the Area
Average Home Value in this Area
Purchase History
| Date | Buyer | Sale Price | Title Company |
|---|---|---|---|
| Bingham Kurt A | $225,900 | None Available | |
| Lc Strategic Realty Llc | $110,000 | None Available | |
| Ae Buffalo Ptopeerites Llc | $72,000 | None Available |
Source: Public Records
Mortgage History
| Date | Status | Borrower | Loan Amount |
|---|---|---|---|
| Open | Bingham Kurt A | $180,720 |
Source: Public Records
Tax History Compared to Growth
Tax History
| Year | Tax Paid | Tax Assessment Tax Assessment Total Assessment is a certain percentage of the fair market value that is determined by local assessors to be the total taxable value of land and additions on the property. | Land | Improvement |
|---|---|---|---|---|
| 2024 | $3,868 | $256,000 | $16,600 | $239,400 |
| 2023 | $3,702 | $256,000 | $16,600 | $239,400 |
| 2022 | $3,556 | $168,000 | $18,000 | $150,000 |
| 2021 | $2,991 | $135,000 | $18,000 | $117,000 |
| 2020 | $2,957 | $135,000 | $18,000 | $117,000 |
| 2019 | $5,101 | $135,000 | $18,000 | $117,000 |
| 2018 | $2,880 | $135,000 | $18,000 | $117,000 |
| 2017 | $757 | $125,000 | $18,000 | $107,000 |
| 2016 | $2,942 | $125,000 | $18,000 | $107,000 |
| 2015 | -- | $125,000 | $18,000 | $107,000 |
| 2014 | -- | $125,000 | $18,000 | $107,000 |
Source: Public Records
Map
Nearby Homes