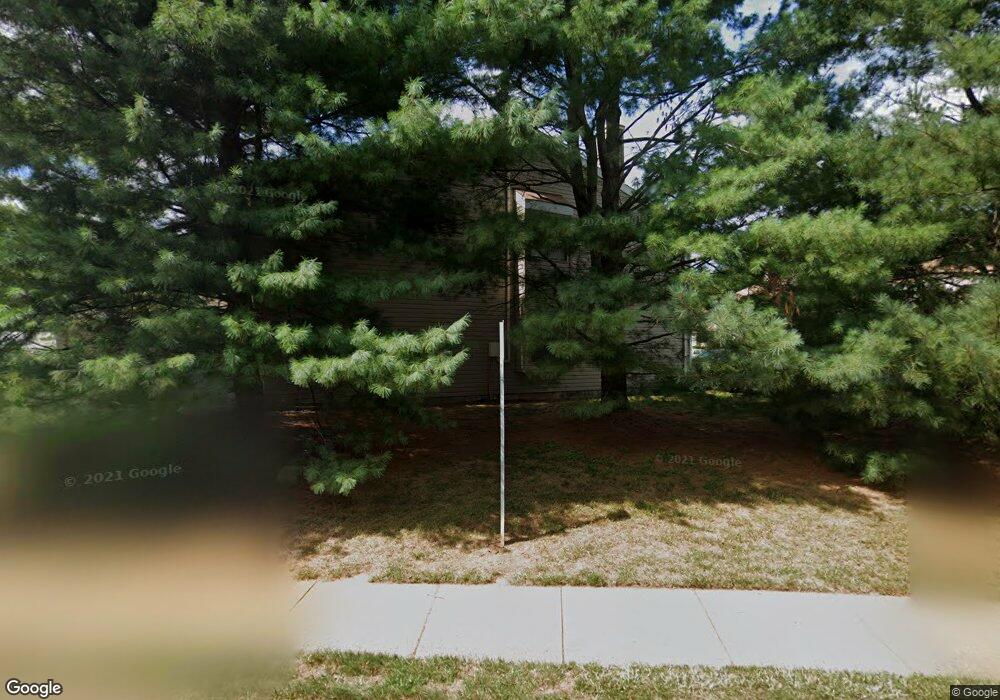
15 Iris Ct Tinton Falls, NJ 07724
Estimated Value: $481,000 - $558,000
3
Beds
2
Baths
1,710
Sq Ft
$297/Sq Ft
Est. Value
About This Home
This home is located at 15 Iris Ct, Tinton Falls, NJ 07724 and is currently estimated at $508,241, approximately $297 per square foot. 15 Iris Ct is a home located in Monmouth County with nearby schools including Mahala F. Atchinson Elementary School, Swimming River Elementary School, and Tinton Falls Middle School.
Ownership History
Date
Name
Owned For
Owner Type
Purchase Details
Closed on
Feb 9, 2005
Sold by
Lipka Kerrie M
Bought by
Wagner Kelly J
Current Estimated Value
Home Financials for this Owner
Home Financials are based on the most recent Mortgage that was taken out on this home.
Original Mortgage
$167,200
Outstanding Balance
$84,482
Interest Rate
5.66%
Estimated Equity
$423,759
Purchase Details
Closed on
May 31, 1988
Bought by
Collins Julius P
Create a Home Valuation Report for This Property
The Home Valuation Report is an in-depth analysis detailing your home's value as well as a comparison with similar homes in the area
Home Values in the Area
Average Home Value in this Area
Purchase History
| Date | Buyer | Sale Price | Title Company |
|---|---|---|---|
| Wagner Kelly J | $176,000 | -- | |
| Collins Julius P | $157,500 | -- |
Source: Public Records
Mortgage History
| Date | Status | Borrower | Loan Amount |
|---|---|---|---|
| Open | Wagner Kelly J | $167,200 |
Source: Public Records
Tax History Compared to Growth
Tax History
| Year | Tax Paid | Tax Assessment Tax Assessment Total Assessment is a certain percentage of the fair market value that is determined by local assessors to be the total taxable value of land and additions on the property. | Land | Improvement |
|---|---|---|---|---|
| 2025 | $6,088 | $418,900 | $234,200 | $184,700 |
| 2024 | $5,815 | $418,700 | $211,700 | $207,000 |
| 2023 | $5,815 | $378,100 | $175,000 | $203,100 |
| 2022 | $5,379 | $331,000 | $150,000 | $181,000 |
| 2021 | $5,386 | $277,700 | $130,000 | $147,700 |
| 2020 | $5,201 | $259,400 | $115,000 | $144,400 |
| 2019 | $5,386 | $269,300 | $115,000 | $154,300 |
| 2018 | $5,252 | $262,100 | $115,000 | $147,100 |
| 2017 | $5,291 | $257,600 | $115,000 | $142,600 |
| 2016 | $5,371 | $256,000 | $115,000 | $141,000 |
| 2015 | $5,025 | $242,300 | $105,000 | $137,300 |
| 2014 | $5,357 | $246,400 | $110,000 | $136,400 |
Source: Public Records
Map
Nearby Homes